How to take thread dumps and analyze them
Why do we collect thread dumps with CPU details?
Thread dumps are the most useful tool for investigating performance problems. If an instance is slow or experiencing outages, a thread dump gives us a snapshot of what is happening in the instance at exactly that time. A sequence of thread dumps allows us to look at what is going on over time in an instance. A thread dump reveals if there is some performance issue with the app code itself, which is most often where performance issues are found. Thread dumps also often reveal what other diagnostic artifacts are required.
You should collect a series of thread dumps along with CPU details to help assess performance problems like slow page rendering or a spike in CPU activity. This is also useful if the app is behaving strangely in some way that is not performance-related. These are essential for troubleshooting so we can learn what the app is working on and what processes are CPU intensive.
Thread dumps should be collected quickly when problems occur. Note: It is important to collect these before restarting the app; otherwise, we will not have critical data to help analyze the problem.
Step-by-step guide
How to collect thread dumps
Atlassian Premier Support has provided a helper script, Bitbucket, to capture thread dumps alongside the CPU details.
We recommend capturing both sets of details every 10 seconds for a minute (six copies). It will help to paint a better picture of what's holding onto the resources and causing performance issues.
If the helper script doesn't work for you, there is an alternative. It requires
jstack in your path from the same Java™ Platform, Standard Edition Development Kit (JDK™) that runs your Atlassian product (referred to by the $prod variable).1$prod_PID=`ps aux | grep -i $prod | grep -i java | awk -F '[ ]*' '{print $2}'`; for i in $(seq 6); do top -b -H -p $prod_PID -n 1 > $prod_cpu_usage.`date +%s`.txt; jstack $prod_PID > prod_threads.`date +%s`.txt; sleep 10; doneIf you have trouble with jstack or the thread dump files are empty for some other reason, please use this alternate form, then zip and attach both the
.txt files and your $prod_INSTALL/logs/catalina.out file:1$prod_PID=`ps aux | grep -i $prod | grep -i java | awk -F '[ ]*' '{print $2}'`; for i in $(seq 6); do top -b -H -p $prod_PID -n 1 > $prod_cpu_usage.`date +%s`.txt; kill -3 $prod_PID; sleep 10; doneHow to read thread dumps files
While thread dumps can be read using a standard text editor, you can use other tools to help analyze the thread dumps.
3rd Party Tools
Vendor | Free option available | Cloud | On-premise |
|---|---|---|---|
fastThread
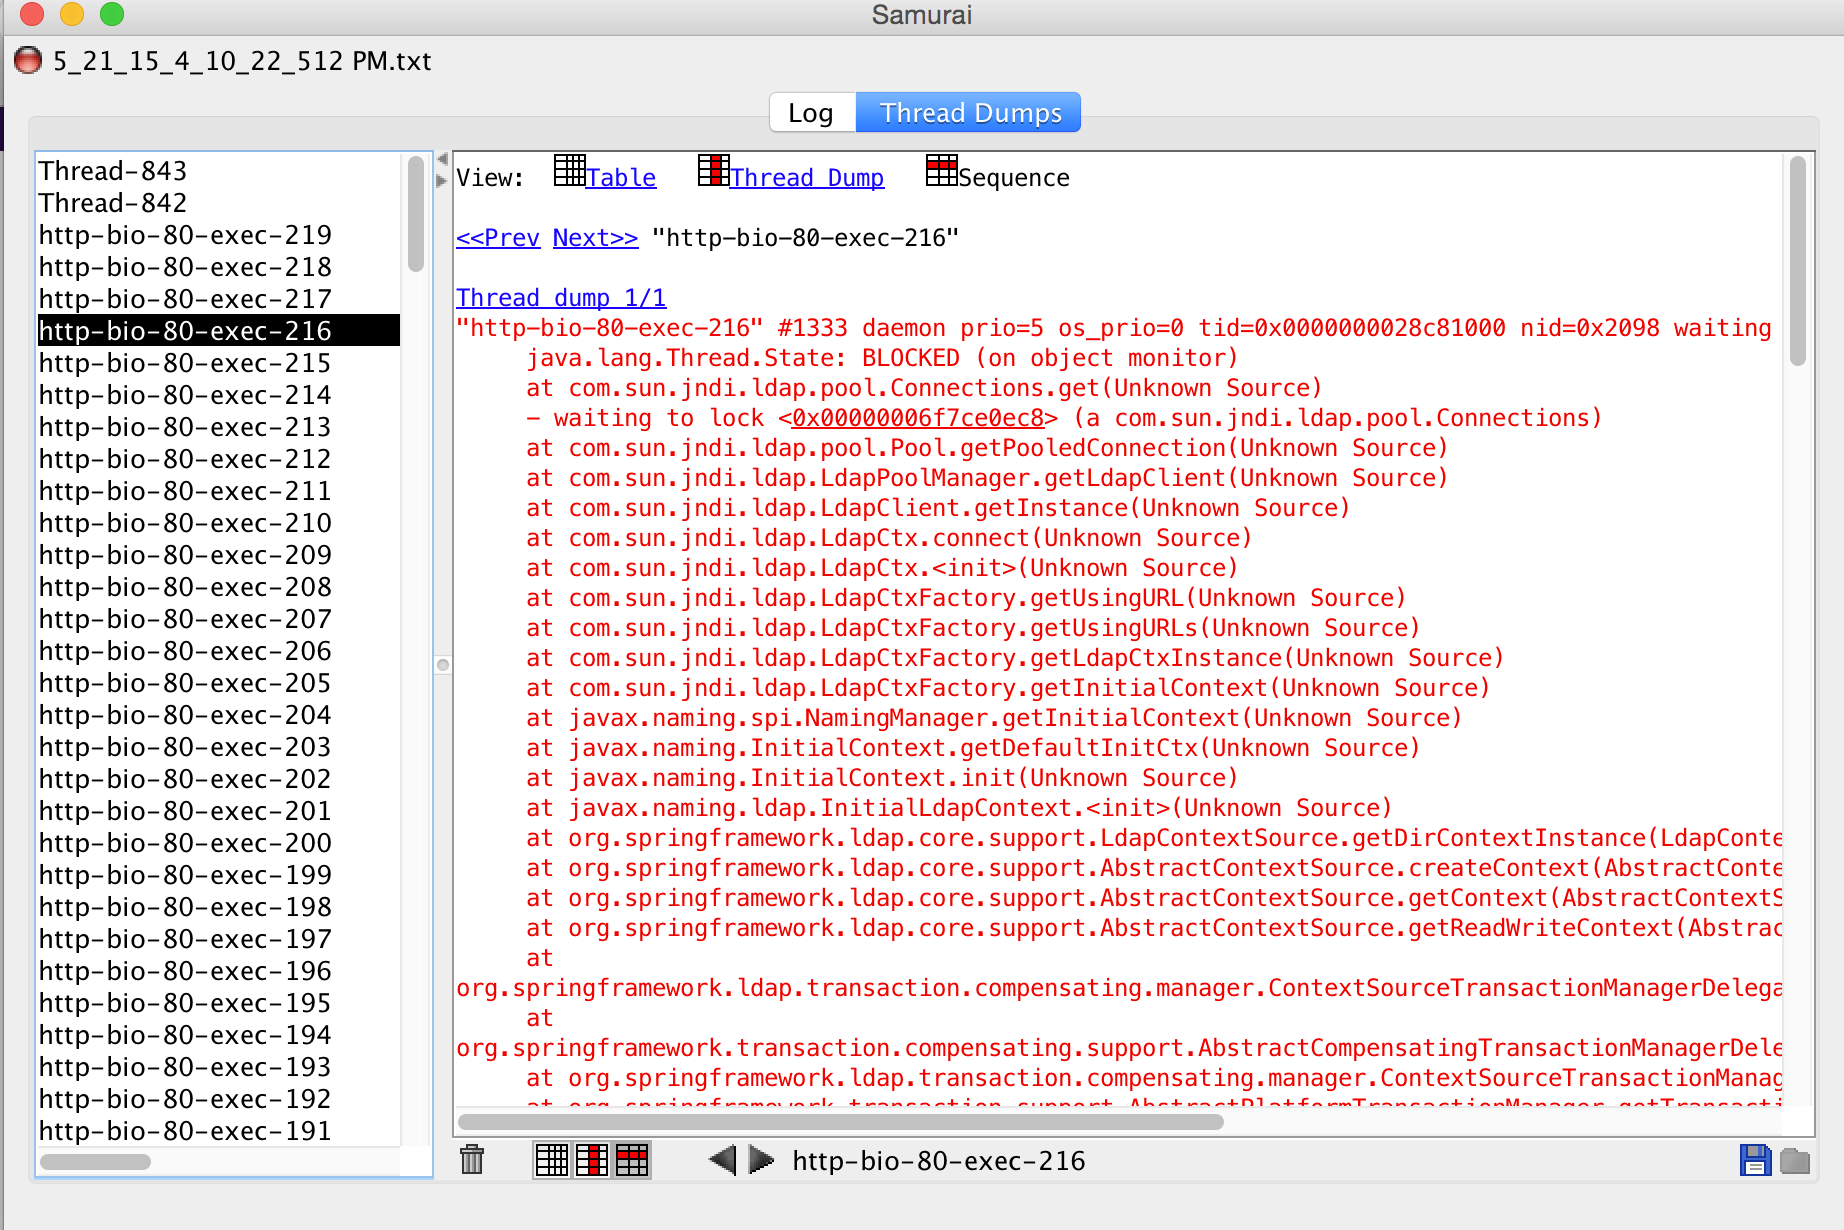
Samurai Analyzer

What to look for?
The primary reason for analyzing thread dumps and CPU usage is to identify threads that are blocking resources or threads that run for a long time and consume a lot of CPU cycles.
- First, you may want to start looking into the CPU usage output and see if there are long-running processes with high CPU usage.
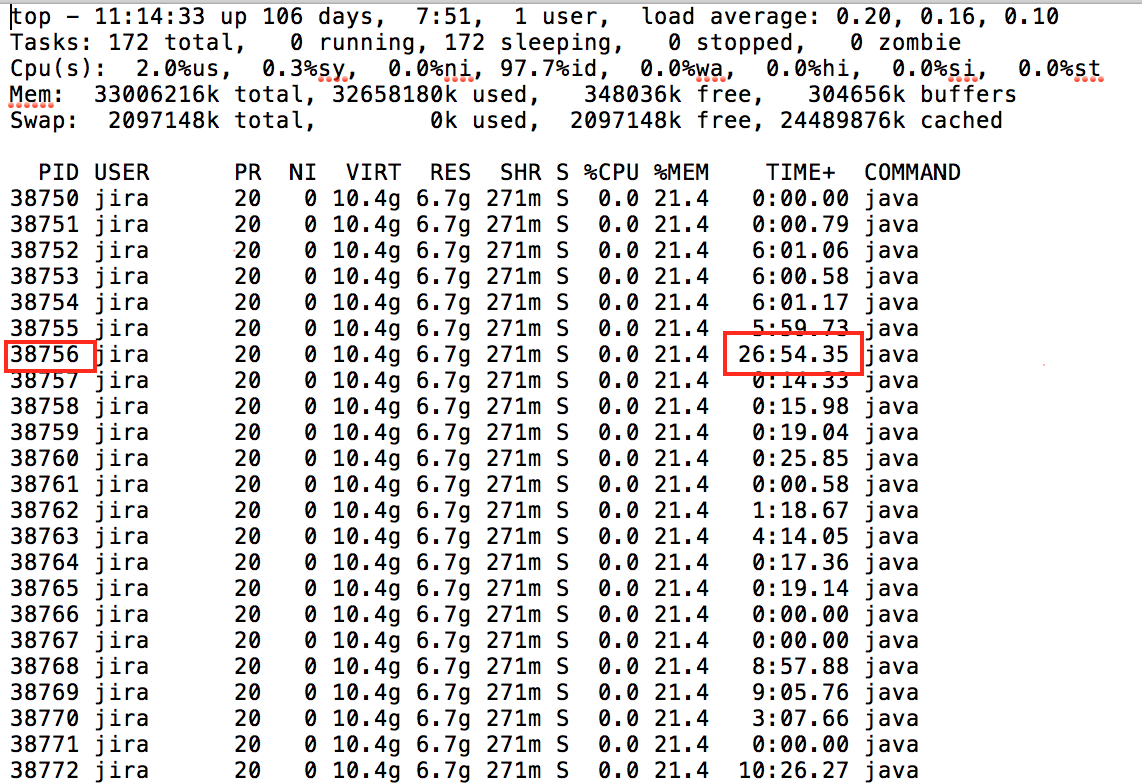
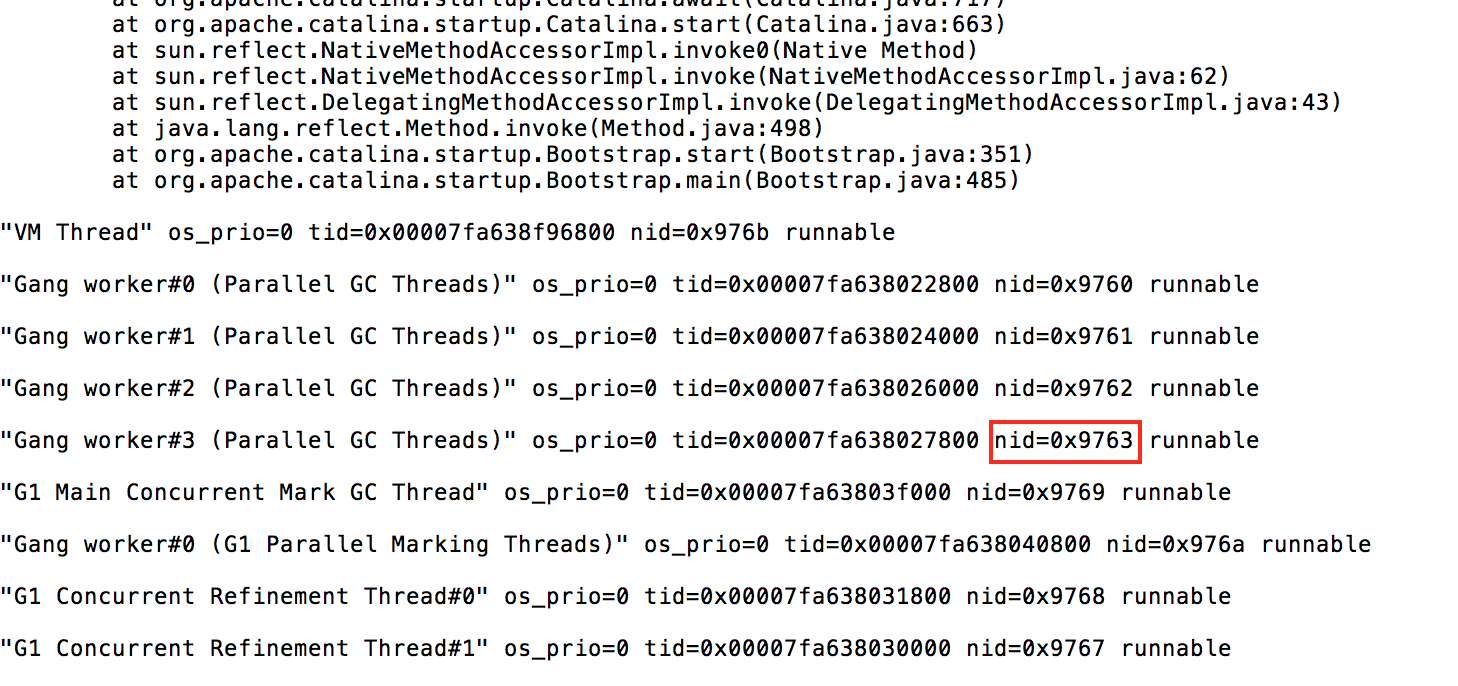
- After you identify the PID to investigate further, you can convert that to hexadecimal to find the corresponding thread using the nid value. For example,
38756converts to0x9764.
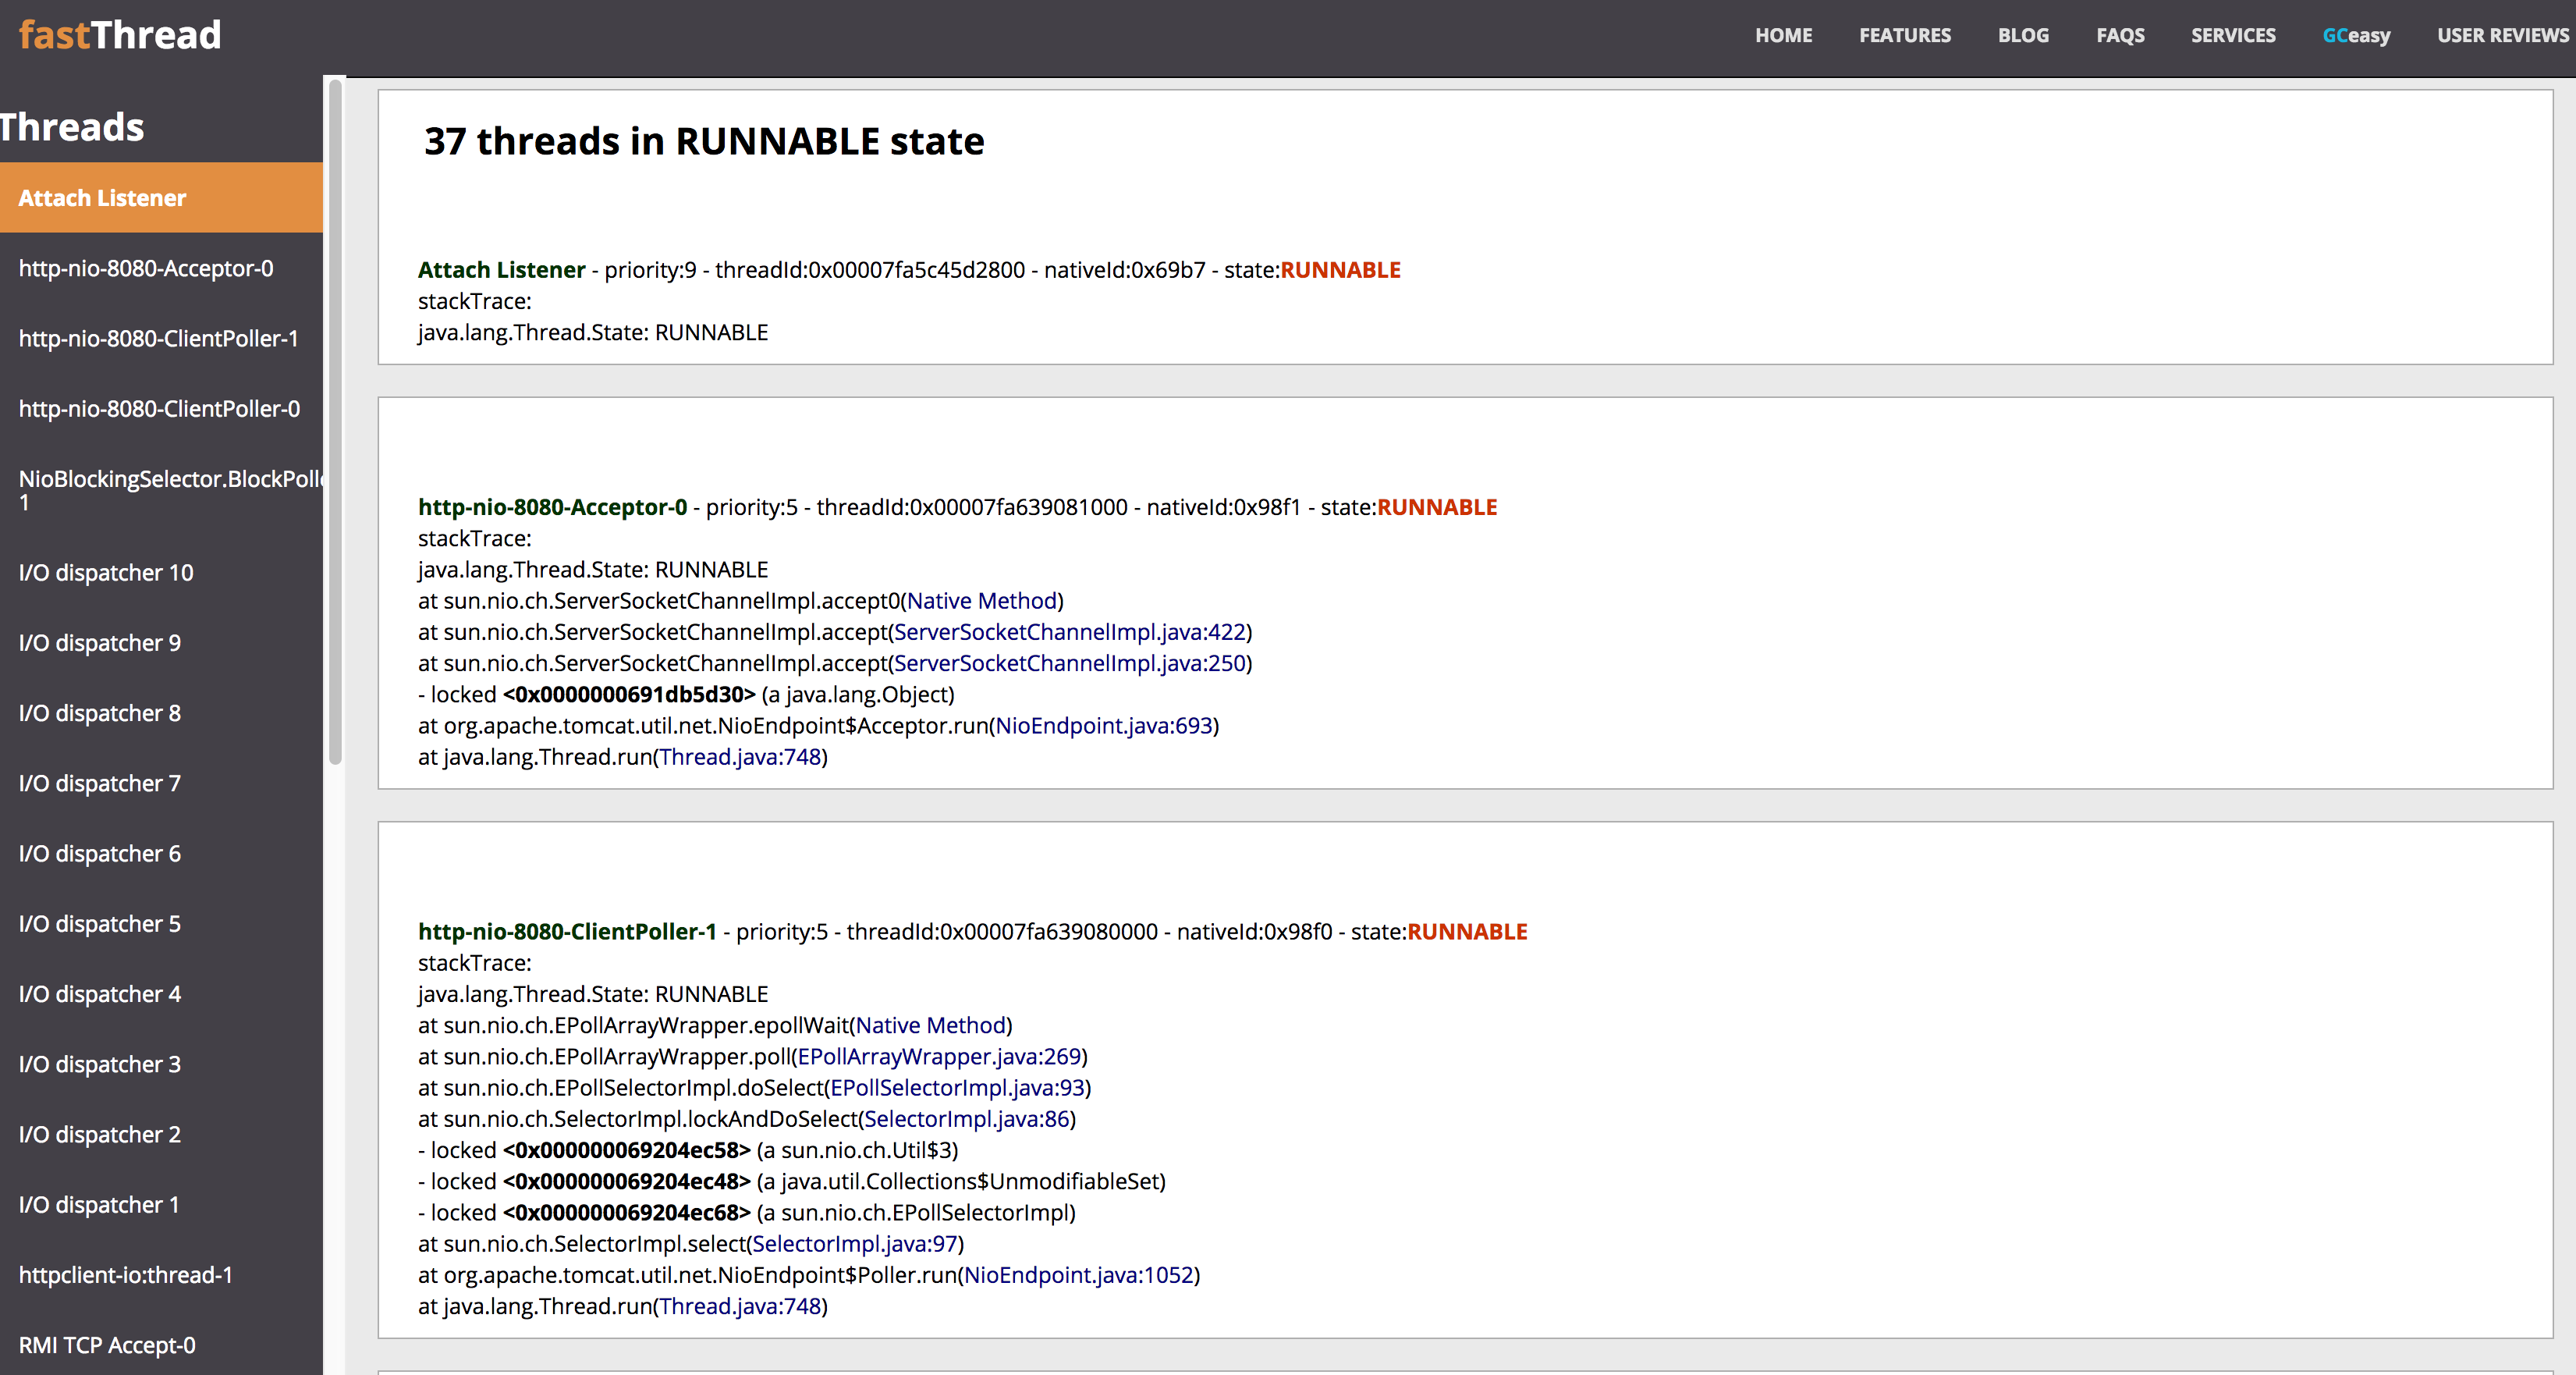
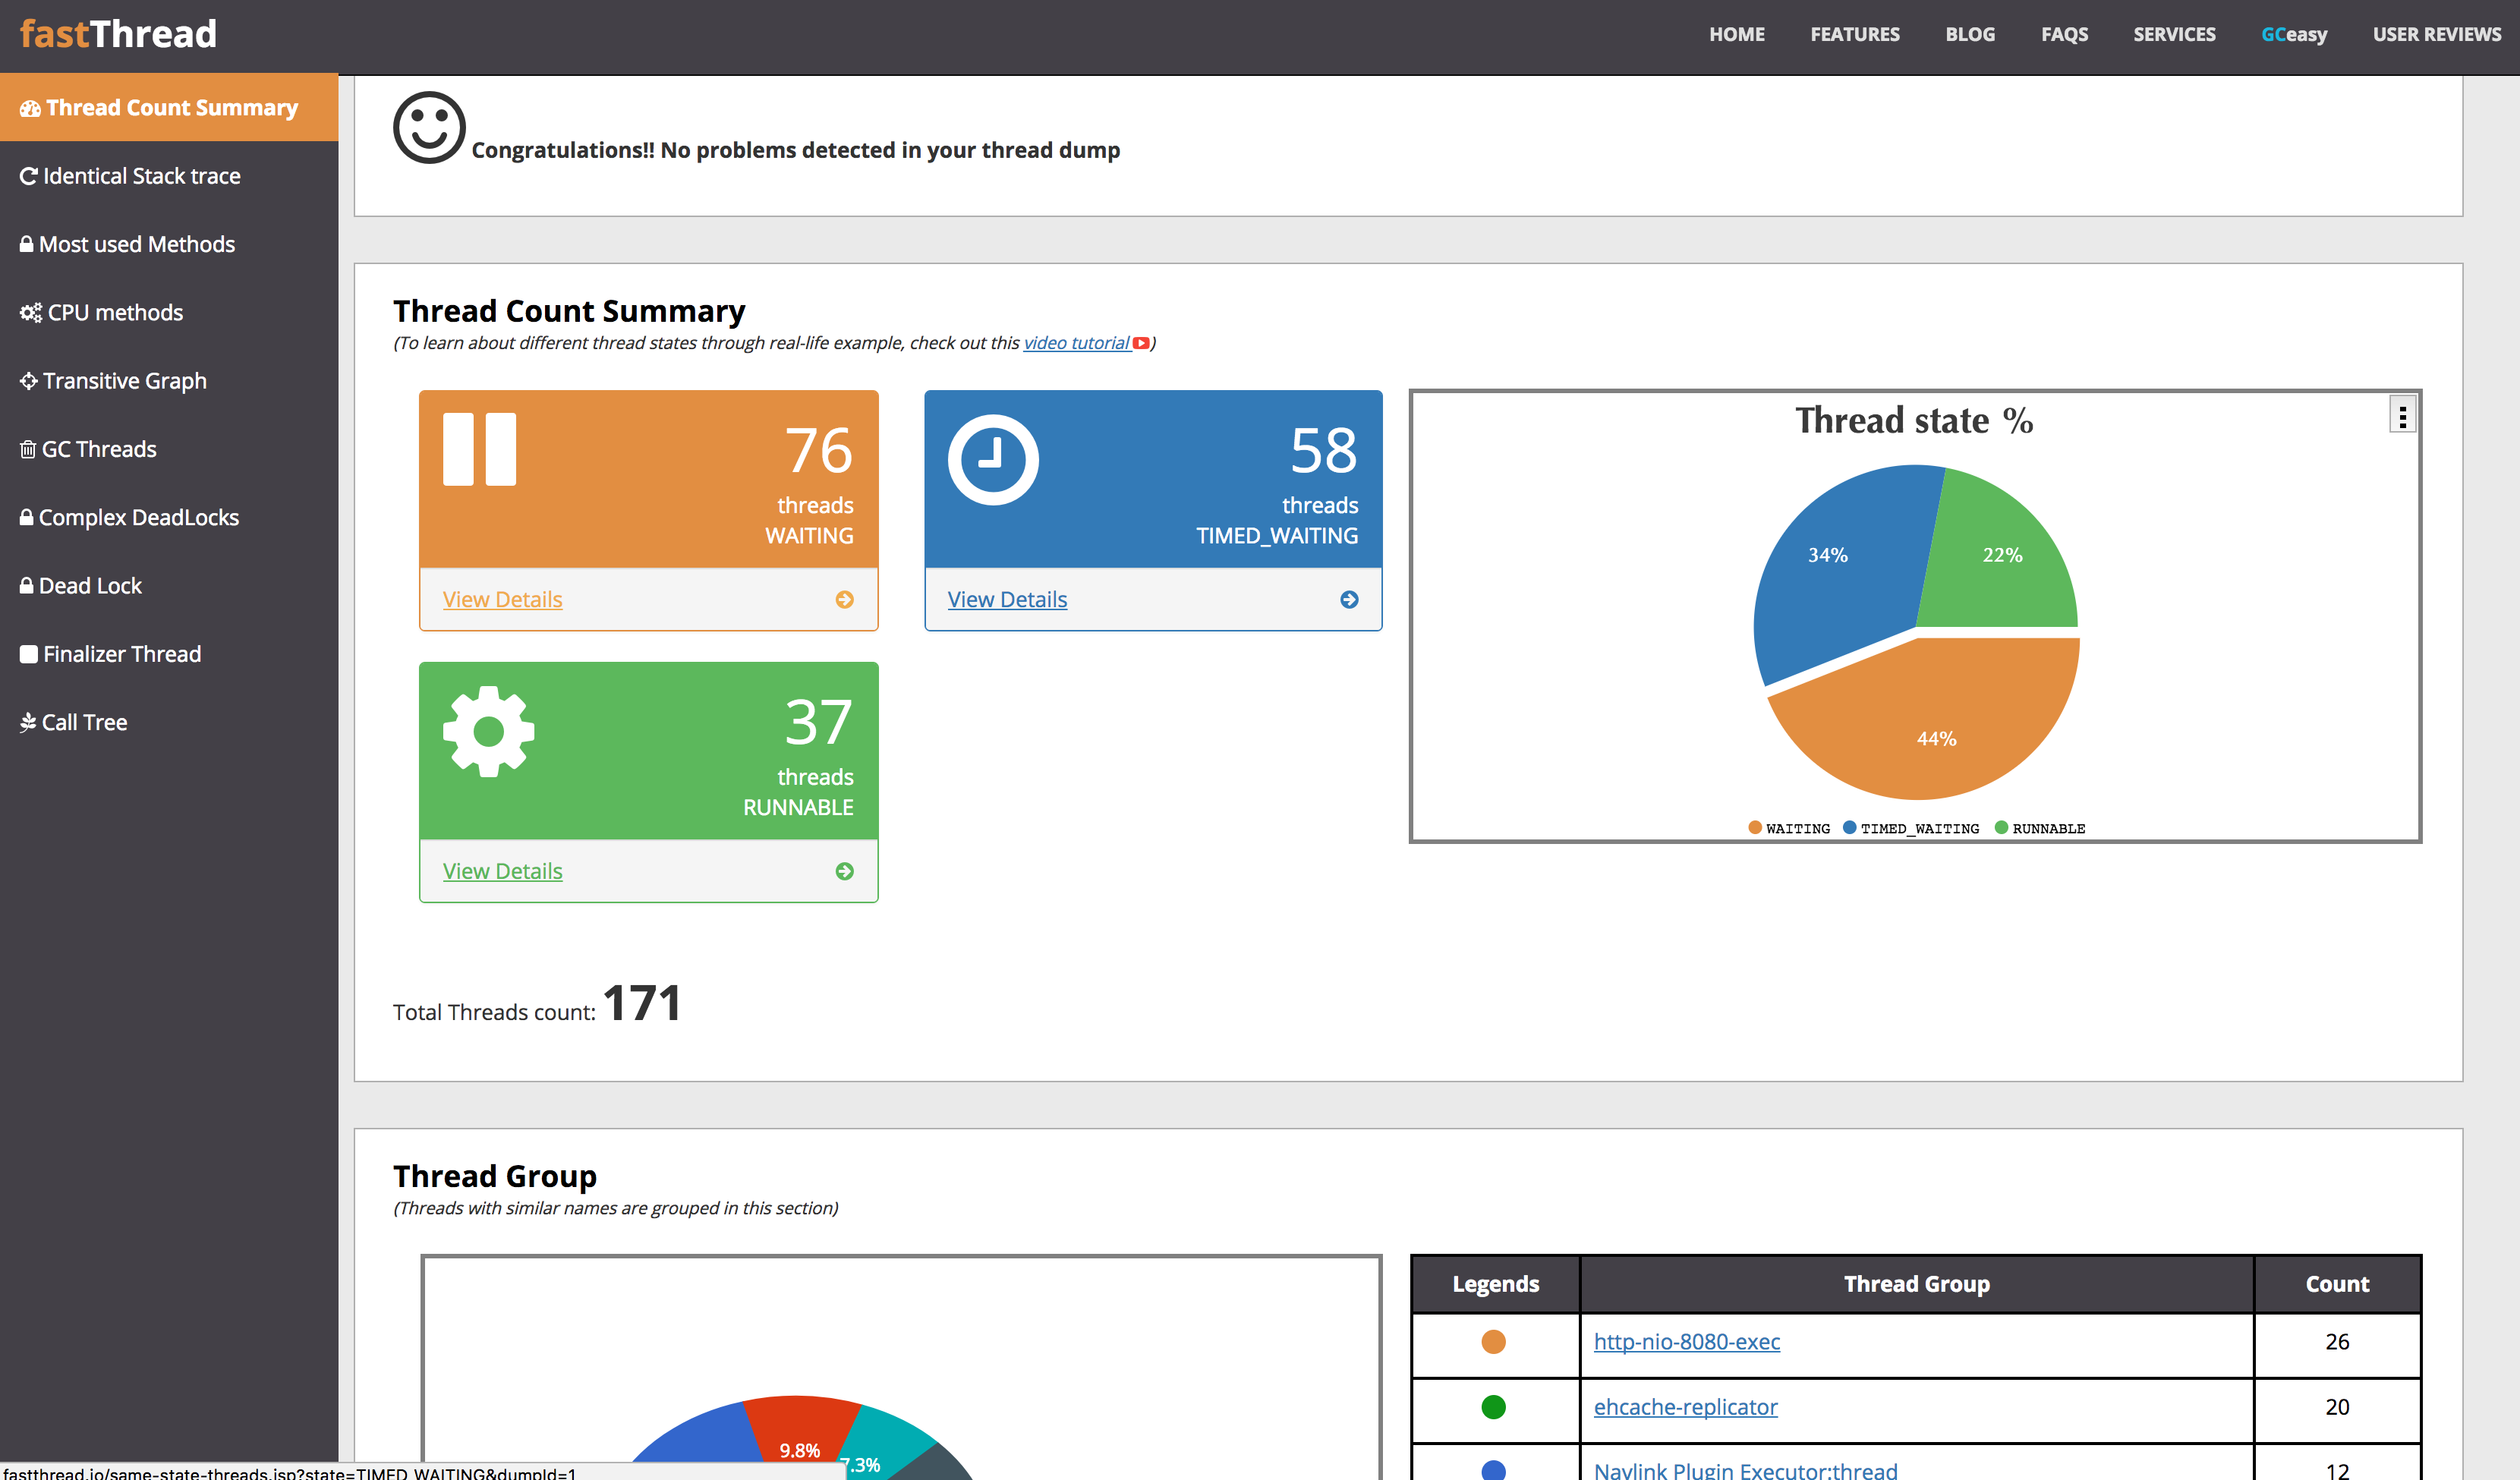
- A more thorough thread dump analysis can be done using one of the 3rd party tools. The following example shows screenshots from fastThread.io
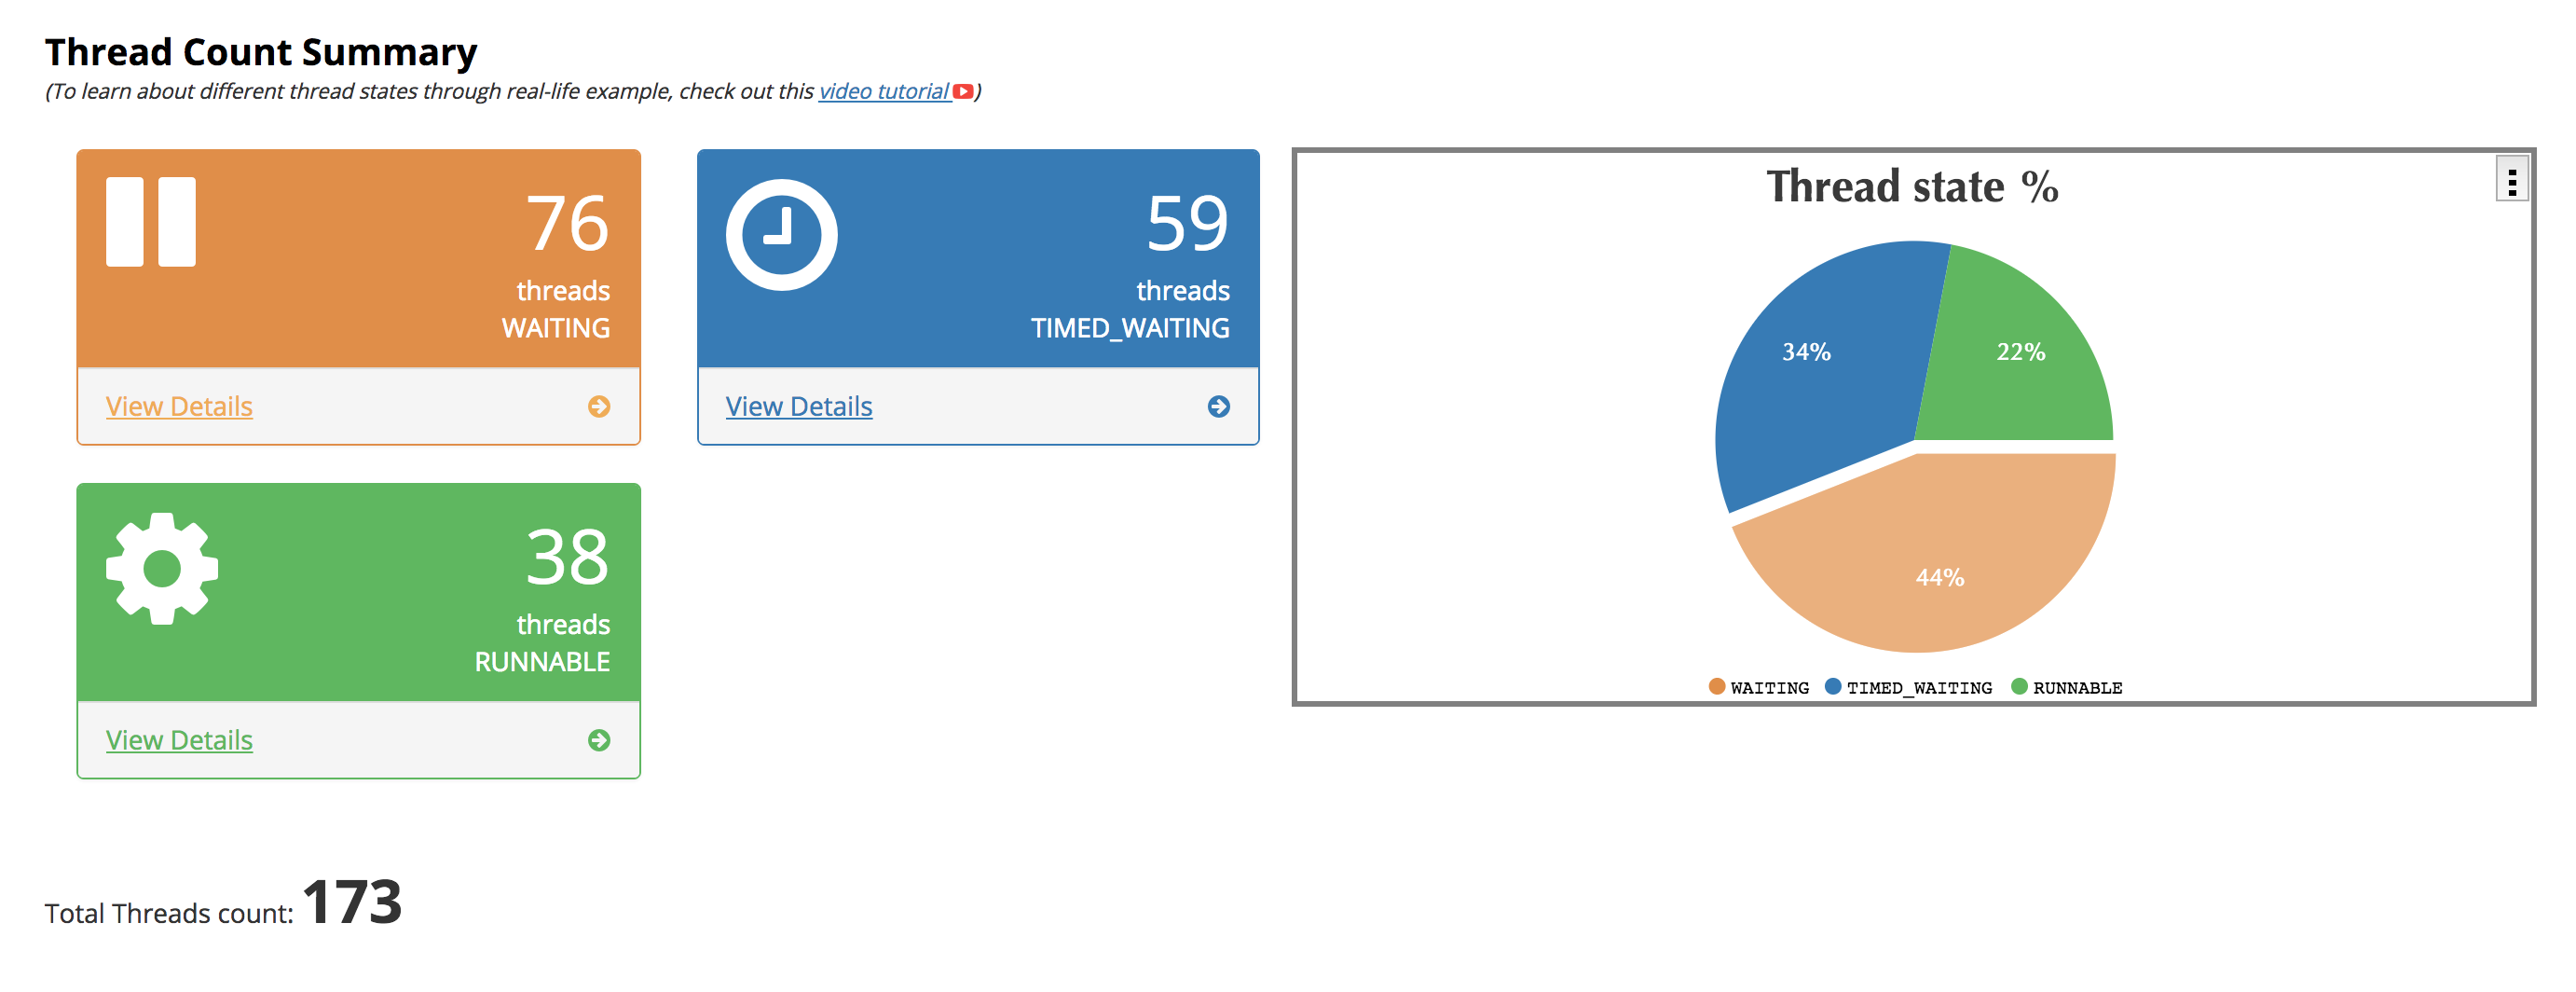
- First, look at the number of threads count. If the number of threads is in the thousands, then you know there's a performance issue.
- The runnable threads are usually the ones to look at first, as they are the threads that are running and potentially blocking others.
- Select View Details to show you all the threads' details.
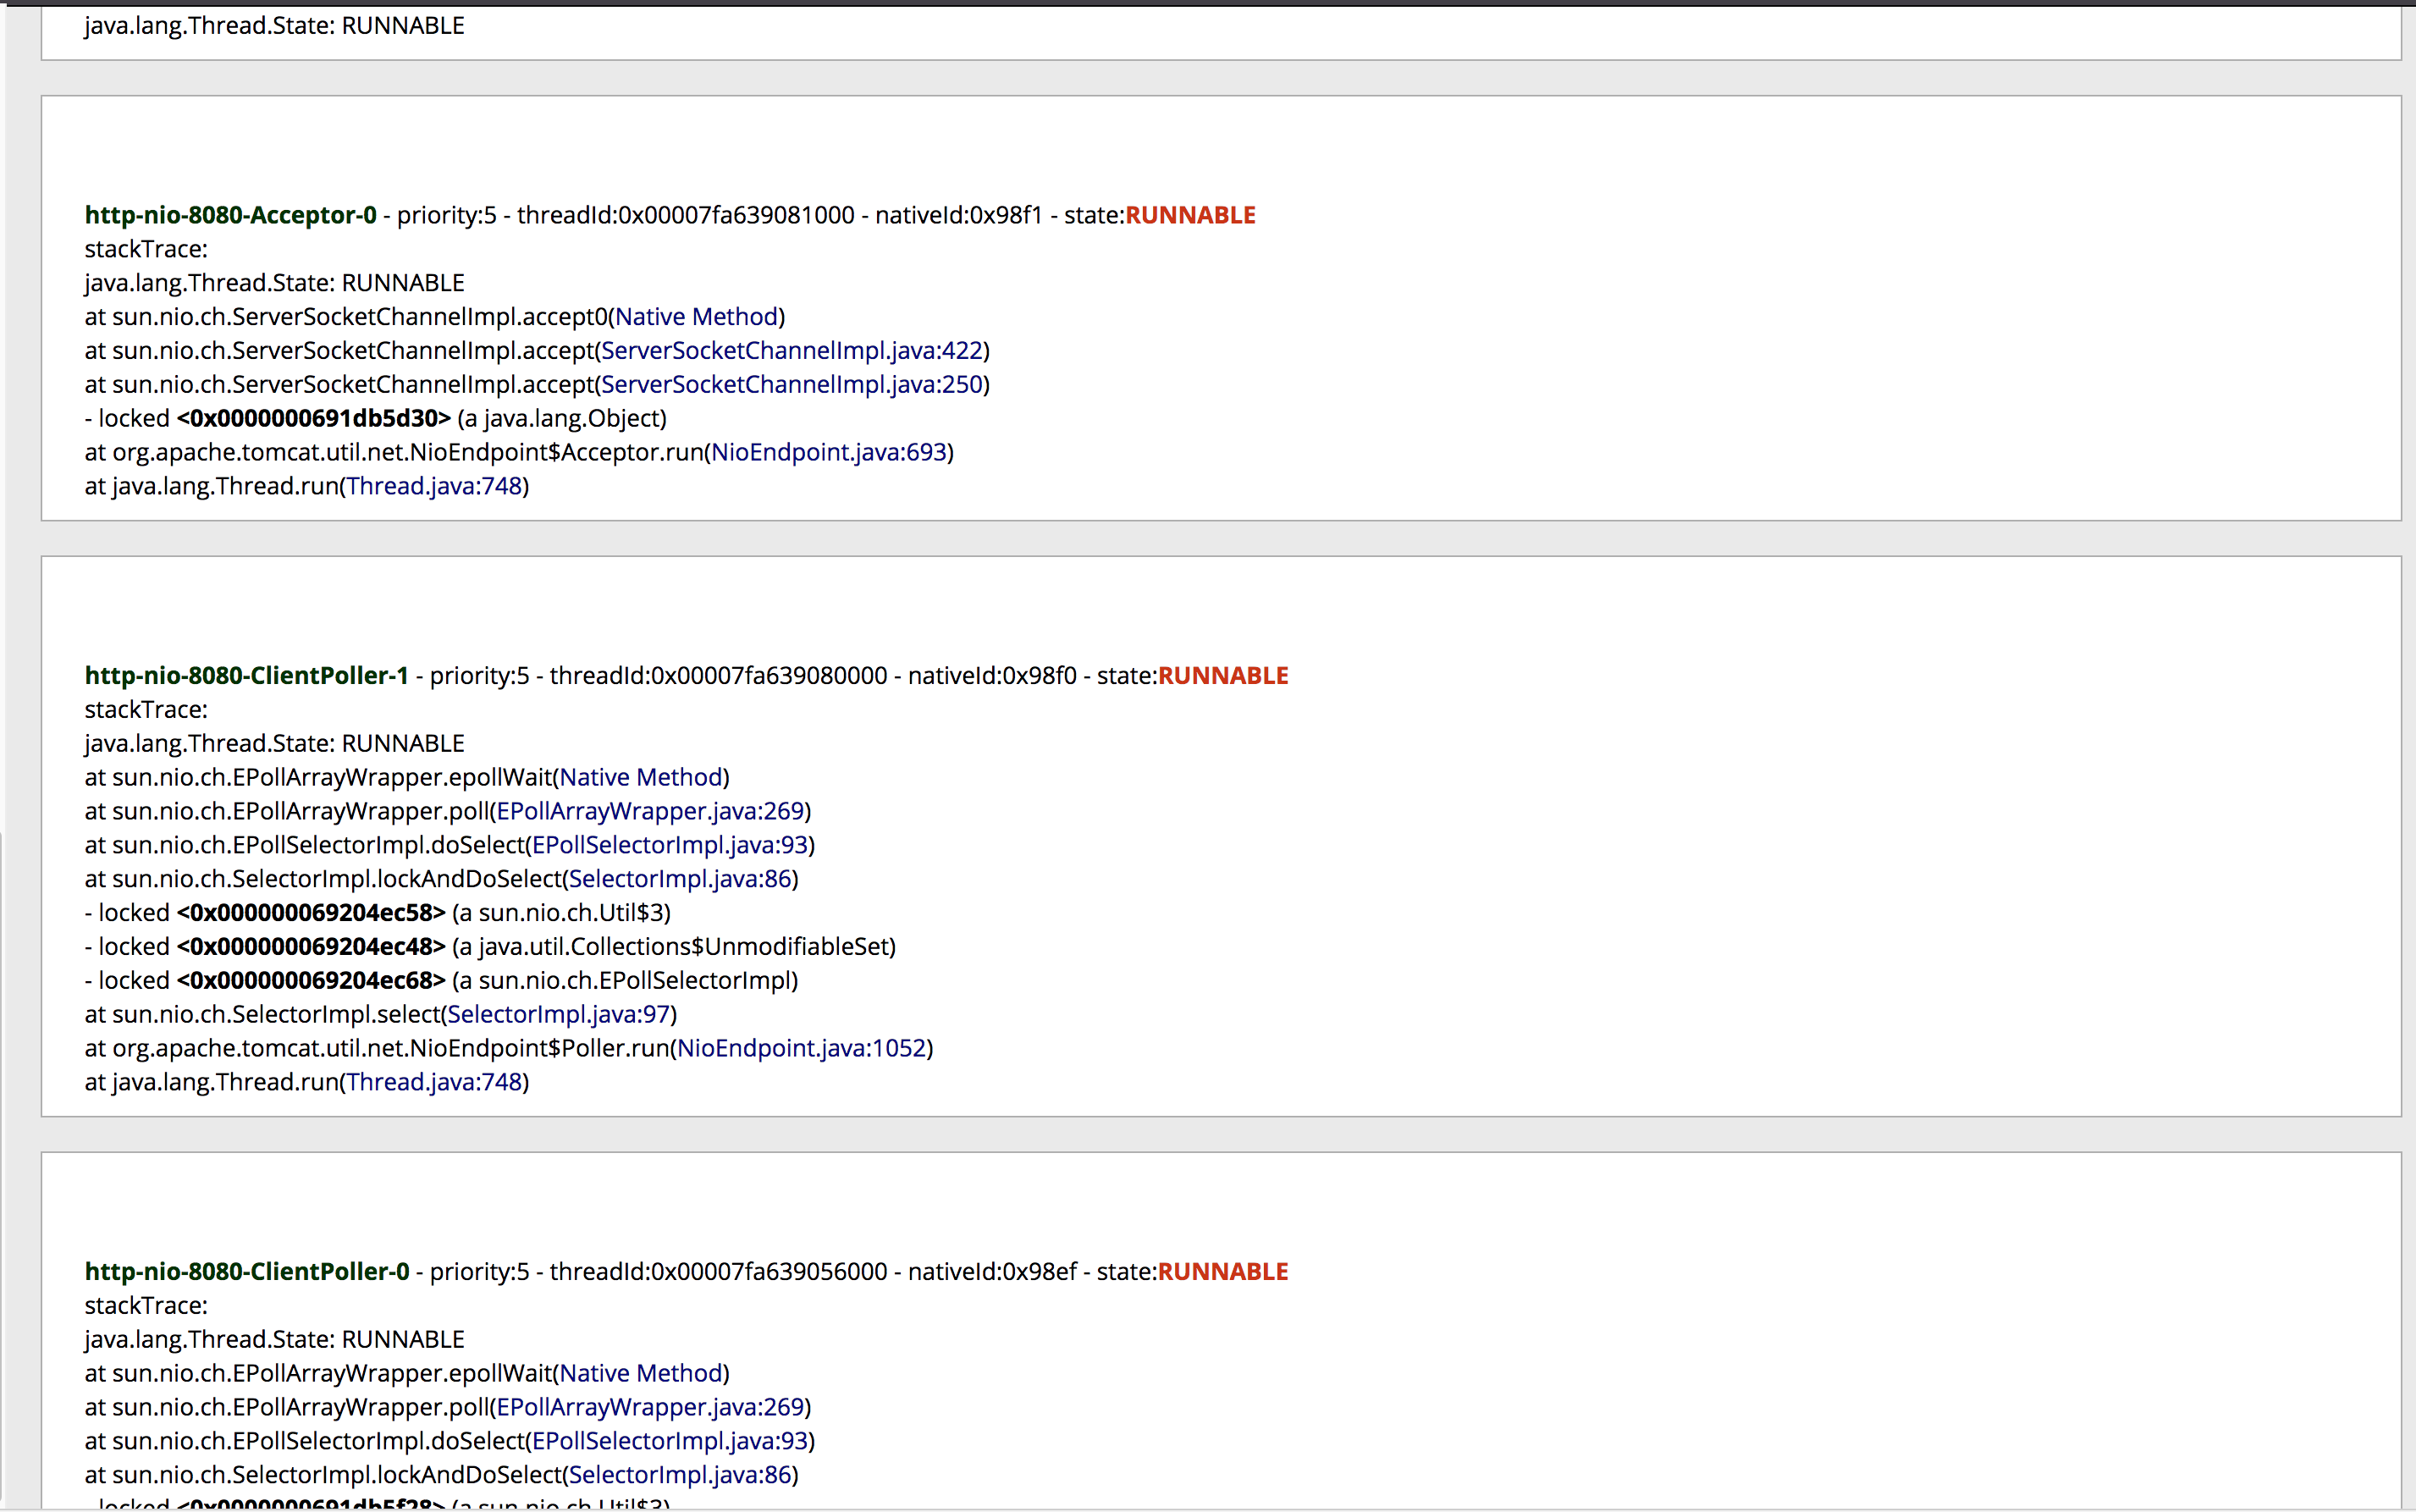
- The stack trace of suspicious threads usually contains more than one page.
- The stack trace should be read from the bottom up.
- Administrators should keep a note of frequent repeating classes, as well as add-on, plugin, and app classes.
If all the information is available, you should have a good idea about the cause of the issue by following the steps above. A couple of possible outcomes after the analysis:
- Report a known issue internally if the performance issue is caused by an outage or change in the environment (for example, a network outage).
- Work with the internal development team if customized add-ons or apps cause the performance issue.
- Log a support ticket with the Atlassian Premier Support team if the performance issue is caused by some classes Atlassian product related.
- Log a support ticket with 3rd party vendor if the performance issue is caused by add-ons or apps misbehaving.
Was this content helpful?
Connect, share, or get additional help
Atlassian Community