The following information is meant to help you start conversations about your internal storage design and needs for use with Atlassian Data Center tools. We've also provided some troubleshooting tips to assist you as needed.
Storage is not a simple subject, it's a topic that requires thought and careful implementation in order to build a successful design. Engineering teams have been working on shared, clustered, and highly available storage for decades. It is our intent to share some of our knowledge and practices for using or deploying storage services and solutions in your environment.
Please review the appropriate hardware requirements pages to determine the needs for your Atlassian product(s).
Internet Small Computer Systems Interface (iSCSI, pronounced eye-skuh-zee) is an IP-based storage networking standard for linking data storage facilities. It provides block-level access to storage devices by carrying SCSI commands over a TCP/IP network. iSCSI is used to facilitate data transfers over intranets and to manage storage over long distances. It can be used to transmit data over local area networks (LANs), wide area networks (WANs), or the Internet and can enable location-independent data storage and retrieval.
The term SAN stands for storage area networks. The SAN protocol allows organizations to consolidate storage into storage arrays while providing clients (such as databases and web servers) with the appearance of having locally attached SCSI disks. It mainly competes with Fibre Channel, but unlike traditional Fibre Channel which usually requires dedicated cabling, iSCSI can be run over longer distances using existing network infrastructure. iSCSI was pioneered by IBM and Cisco in 1998 and submitted as a draft standard in March 2000.
An iSCSI SAN therefore is merely a SAN dedicated locally over TCP/IP. You can see an example of a typical iSCI SAN in this diagram.
In a data center, you would never deploy storage traffic on the same network, switch, or even fabric as standard Ethernet traffic is used by applications and users. A typical design will include dedicated infrastructure for the SAN. As shown in linked diagram above, standard networking operates on Fabric A, which may include clients and applications. Fabric B and C are dedicated to storage.
Due to this, we have specialized networks just for storage I/O including:
Dedicated PCI-E lanes for network adaptors
Specialized ASICs on storage type
Low latency
Packet and frame throughput
Jumbo frames (more I/O in a a single frame!)
Dedicated network adaptors for the traffic type
Dedicated network switches for traffic types
Fibre Channel
InfiniBand
iSCSI
Backplane switching over several ASICs
Fabric networks without routing (No overhead, less latency, no switch or router traversal)
No VLANs
This design is very common, but also used in Network File System (NFS) networking for virtualization and high-performance clustering to support thousands of virtual machines.
This is only a brief overview of the subject, but it shows that a lot of thought is put into designing and delivering high-speed storage that offers high-throughput traversal of data in low-latency networks. It requires considerable effort to deliver effective storage and access solutions that will result in optimal performance for your applications.
So why do we need to understand this better?
In the application space, you will need to provide shared network storage for Data Center products. The problems you may face are directly related to storage configuration and deployment. For every millisecond that a response takes that is less than optimal, the longer it will take the application to respond. This can have a negative effect on the overall perception of how fast the application responds for your end users.
NFS can be easily deployed by customers on Windows and Linux, or easily shared out from NAS devices, or even directly from your SAN devices. These solutions, while less costly, will tend to work in the short term, but will show signs of sluggishness as you begin to scale into true enterprise scalability. In order to help you provide better solutions for your environment, we have spent time working on solutions to assist in your configuration.
Solutions & guidance considerations
Not every solution provided herein will be possible for everyone, and we are aware of these limitations. However, working on even some of these changes could provide as much as a 15% performance improvement in storage. Considering that shared storage is used for indexing, attachments, and other aspects of Data Center products, this can significantly improve end-user experience as well.
Build or attach to dedicated storage networks
Avoid having application or “LAN” traffic on your storage network
Use storage-optimized NICs and switches in the separate SAN
Use dedicated NICs on this network with iSCSI or storage optimizations
Use virtual adaptors connected to a storage vSwitch
Perform hardware offloading to the physical NIC
Full duplex settings on switch ports and NICs without auto-negotiation
“Jumbo frames” on the entire network
Every point in a storage network must use the same or larger frame size (MTU 9000+)
If the MTU for jumbo frames on this network is not correct, you may incur data corruption and see no improvements
Avoid IP fragmentation
More I/O can be sent in a single frame
This includes physical NICs on the server, switch ports, virtual switches, and virtual adaptors
Eliminate VLANs and routing
VLANs add Ethernet overhead, it’s best to avoid them
As soon as you introduce routing, you incur a performance penalty for every packet
This means subnets/availability zones, etc.
Use multiple network paths and load balance
Load balance at the switch and NIC
Optimize settings
Use FAST handshaking
Use TCP recycling
Ensure NIC frame buffers are optimized on NICs/virtual adaptors and offloaded to hardware (TSO)
Not possible in cloud deployments
Use high-performance vNICs such as VMNETX3
Match the stripe/block size to match the provisioned LUN/Volume/RAID settings in rsize/wsize
defaults may be too big or too small, adjust these to suit the desired workload
Provision stripe sizes for storage
Enable or disable RX/TX flow control pending your device/NFS server recommendations
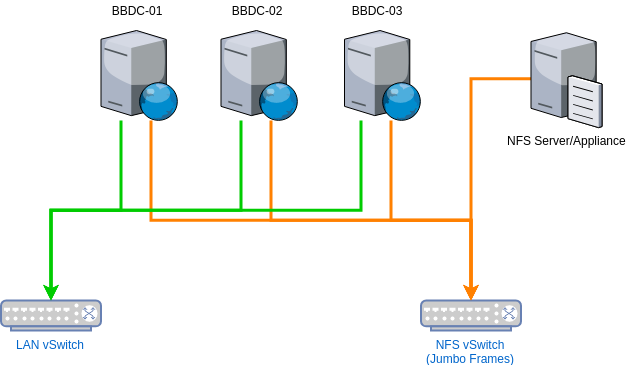
A simple design for this on vSphere with dedicated virtual switches, network interfaces, larger frames, and reduced latency is shown below:
Key benefits:
Dedicated networks for application traffic (users/client side)
Dedicated networks for NFS/storage/clustering (node to node or server to storage)
Reduced latency
Increased bandwidth
Better availability
Better scalability
Roll your own custom NFS
Linux based NFS servers are powerful, scalable, and simple to deploy. Using the above guidelines, you can optimize your deployment for different workloads and requirements. Each Atlassian application has different workload and I/O requirements, so it’s important to understand the I/O workloads to work with your infrastructure teams to get the most out of your environment.
Application
IO profile
Disk recommendation
Bitbucket
Very small (<1mb, random IO)
NVMe, SSD, hybrid
Bamboo
Very small (<1mb), random IO + sequential IO (artifacts)
NVMe, SSD, hybrid
Jira
Small/medium (1-4mb), random IO
NVMe, SSD, hybrid
Confluence
Medium/large, random IO + sequential IO
NVMe, SSD, hybrid, RAID HDD
This is a high level example. Use cases and workloads can change by users, projects, use of applications, business model, and industry.
Linux environments
Using an enterprise and production-grade Linux is highly recommended, as this will provide better support overall. Typically, NFS servers perform network/IO passthrough to disk. This is mostly a kernel/CPU intensive operation, thus requiring minimal memory footprints.
A Linux NFS server could be made from the following specs:
Profile
CPU
Memory
Notes
Small
4vCPU
4GB+
Small instances
Single node
Medium
8vCPU
8GB+
Medium-sized instances
2-3 application nodes
Large
16vCPU+
32-48GB+
Large
High volume
Several applications/nodes
Linux will consume as much memory as possible to provide filesystem and object caching by default. More memory can increase these caches.
Test different profiles and workloads to see which profile suits which application and workload for your tools within your own environment.
A note on Git workloads
Git can be a very resource intensive tool. It can heavily rely on CPU cores, CPU frequency, and system memory, but the greatest factor is disk I/O. Typical workloads on a NAS might be a team storing videos, photos, or large documents or backups. This is typically “sequential IO” and most hard drives can do this pretty well. Storage blocks get lined up, and written in a single “spin” of a HDD.
For example: copying a movie to a hard drive might see 100Mbps+ transfer speeds in disk I/O.
Git, however, behaves the opposite. Git typically handles many small files, which is harder for a traditional disk or RAID system to keep pace with. Benchmarking Git performance can become very difficult and can stress most storage systems due to the random access nature and small size of the file transfers.
For example: copying 100,000 very small files might see 1Mbps+ transfer speeds in disk I/O.
Therefore, it's better to work with disks that can access data with speed for I/O. Solid state drives (SSDs) typically excel over traditional hard disk drives (HDDs) for these workloads. The fastest drives, non-volatile memory express (NVMe) or Non-Volatile Memory Host Controller Interface Specification (NVMHCIS), would be the best recommendation in this area as these excel with parallelism, concurrency, and typically have much greater access and lower latency to the raw data on the drive. Most of today's computers come with NVMe drives and the access times and responsiveness are ideal for data. The downside to NVMe is that it can be much more expensive than either HDD or SSD, but the cost is worth the performance for ideal access.
Infrastructure teams may assist in getting the right solution for your storage for those tools that will access Git.
Troubleshooting tools and documentation
NFS allows for extensible and flexible network-based storage. However, you may run into issues with performance that present challenges to solve. When troubleshooting NFS, you should be aware that there are several teams and components that would need to be verified in order to potentially identify and resolve issues. In order to assist you, the list below (not comprehensive) is provided to start the conversation internally to configure your response teams should these issues arise.
Team
Roles
Ownership
Tools
Network engineering
Network management
Network security
Network capacity
Design & availability
Firewalls, routers
IPS & IDS
Switching
OSI Layers 1-4~
QoS & Bandwidth
Wireshark
TCPDump
Netstat
Switch/router OS CLI and tools
Infrastructure/virtualization
Provide virtual machines
Provide operating system & templates
Monitoring and alerting
Virtualization stacks
vSphere, Hyper-V, Xen
GCP, Azure, AWS
Clustering and HA
Compute capacity (CPU & Memory)
Sometimes manage storage too
Platform-specific tools
VMware monitoring
NMON
Networking tools (tcpdump, wireshark, etc.)
Storage & backups
Provide storage to infra teams
Provide backup targets & solutions
Manage data integrity, availability, capacity
SAN
PureStorage, EMC, HPE 3PAR, IBM, NetApp
NAS
CIFS/NFS Share
File shares for teams
Backups
Veeam, CommVault, Backup-Exec
nfsstat
nfsiostat
tcpdump & wireshark
NMON
SAN & storage utilities
Generally, pulling these teams into a problem or incident with NFS will get the right people in the room and conversation. This is a rough example, teams and ownership may vary in your organization.
NFS documentation
There are many guides to assist you with configuring, implementing, and troubleshooting NFS in your environment. Below are a few linked articles that are available to assist you as needed:
By default, the NFS service is started with 8 threads. This can be adjusted if you have a busy, highly concurrent NFS workload. Adjusting this value (doubling until diminishing returns) could provide additional throughput and better latency in Linux environments.
Tuned is a RHEL/CentOS service that tweaks the kernel and system parameters for different workloads. The tuned service can be installed quickly and easily:
RedHat, Oracle, and IBM provide several profiles for different workloads. Using this tool can help apply some of the best practices within Linux for a target workload. More profiles are found here: tuned/profiles at master · redhat-performance/tuned
You can even write your own profiles, building on an existing one with current tweaks which could be recommended by Premier Support or development.
Troubleshooting tools
Handy tools for troubleshooting NFS performance
More details on using these are found below in the Red Hat documentation.
ethtool
ethtool is a Linux tool for querying and changing NIC settings and very low levels.
1ethtool -S ethX # Displays statistics and errors2ethtool -a ethX # Displays how flow control is performed or enabled3ethtool -K ethX # Displays how offloading is configured
netstat
netstat prints data about open connections and protocol stack stats, including device info, TCP socket info, and Unix sockets.
1netstat -s # Provides error counters
Dropwatch (Redhat)
Dropwatch is a tool used to determine where packets are dropped by the kernel. It's useful in performance cases to narrow down the problem area.
1dropwatch -l kas2> Start3####4Kernel monitoring activated.5Issue Ctrl-C to stop monitoring62 drops at ip_forward+1b7 (0xffffffffbd809777)74 drops at ip_forward+1b7 (0xffffffffbd809777)81 drops at sk_stream_kill_queues+48 (0xffffffffbd7a2158)91 drops at __brk_limit+25100c6 (0xffffffffc0fe70c6)101 drops at ip_forward+1b7 (0xffffffffbd809777)112 drops at ip_forward+1b7 (0xffffffffbd809777)123 drops at ip_forward+1b7 (0xffffffffbd809777)
nfsstat
nfsstat is a performance and stat tracker for NFS/RPC calls. It's useful on the server to diagnose naughty NFS servers.
1nfsstat -r -l # Only RPC2nfsstat -s -l # Only Server Stats3nfsstat -c -l # Only Client Stats
nfsiostat
nfsiostat provides client-side mount statistics. It includes details like:
tcpdump is useful for capturing network data between the NFS client and NFS server. It can also validate packet sizes, frames lengths, timings, and a lot more. It can be parsed by Wireshark:
1tcpdump -vvv -n -i ethX host localhost and nfs-server.com
nmon
nmon is one of the oldest and most powerful performance analysis tools for Linux. Originally developed by IBM and Oracle, this is a very powerful tool with next to zero overhead on the host machine.
nmon has two modes, graphical/TUI shell output and background logging mode. Background logging mode allows for the collection of performance stats which can be parsed later with tools like Excel or Java output tools.
1yum install epel-release -y && yum install nmon
To capture data with 1 second sample intervals:
1nmon -f -t -s 1
This writes a .nmon file to the working directory, which can then be parsed with the following tool.
.nmon files or reports can be shared with your support teams easily.
Measuring success and changes
In order to understand the outcome of any changes made within your environment, you will need to measure data to determine what is effective. For that reason, we do recommend that all such changes are made in a lower environment prior to placing such changes into production. We recommend thorough and heavy testing to tune and configure your network, client, and server environment based on your workloads.
Tips
Always perform benchmarks
Create tests and benchmarks based on your use case and workloads
Examples might include the transfer of lots of small Bitbucket repos, with many small files vs. large photos/documents in Confluence Data Center
Simulate concurrency and user counts
Measure changes between settings and configurations
Involve infrastructure teams early and outline the application workload and requirements
Be sure to document test results, as some tweaks may negatively impact performance
Conclusion
Every network is unique, and your workloads may dictate different solutions. It is important to understand that storage is a major component in Data Center deployments and that greater throughput with lower latency will result in a more performant application.