The guide provides a comprehensive overview of how to deliver and implement Atlassian tools and IT Service Management (ITSM) practices using a standardized delivery process while getting an opinionated view and leveraging best practices. It is written for those of you that are about to set up a Jira Service Management implementation
project.
The target with this guide is to make ITSM implementations easier, with less pain and delivery value quicker. The guide will be regularly updated with new information and
feedback to ensure that it stays current and effective.
Use case: Enterprise IT Operations Management
Incident Management in Jira Service Management.
Problem definition
IT Operation teams are responsible for making sure systems and services are operational in an ever increasing complex environment. It’s critical that they can detect, respond and resolve incidents as fast as possible. We recommend reading our solution play for Incident Management here.
IT Operation teams need to be able to plan for changes, anticipate the impact and who to communicate with. Their customers won’t always know who to contact if something isn’t working as expected and it’s common to have a single point of contact to reach all operation teams.
This, together with incoming alerts, makes the inflow of incidents potentially high and makes dispatching as well as identifying potential causes for incidents crucial.
Solution description
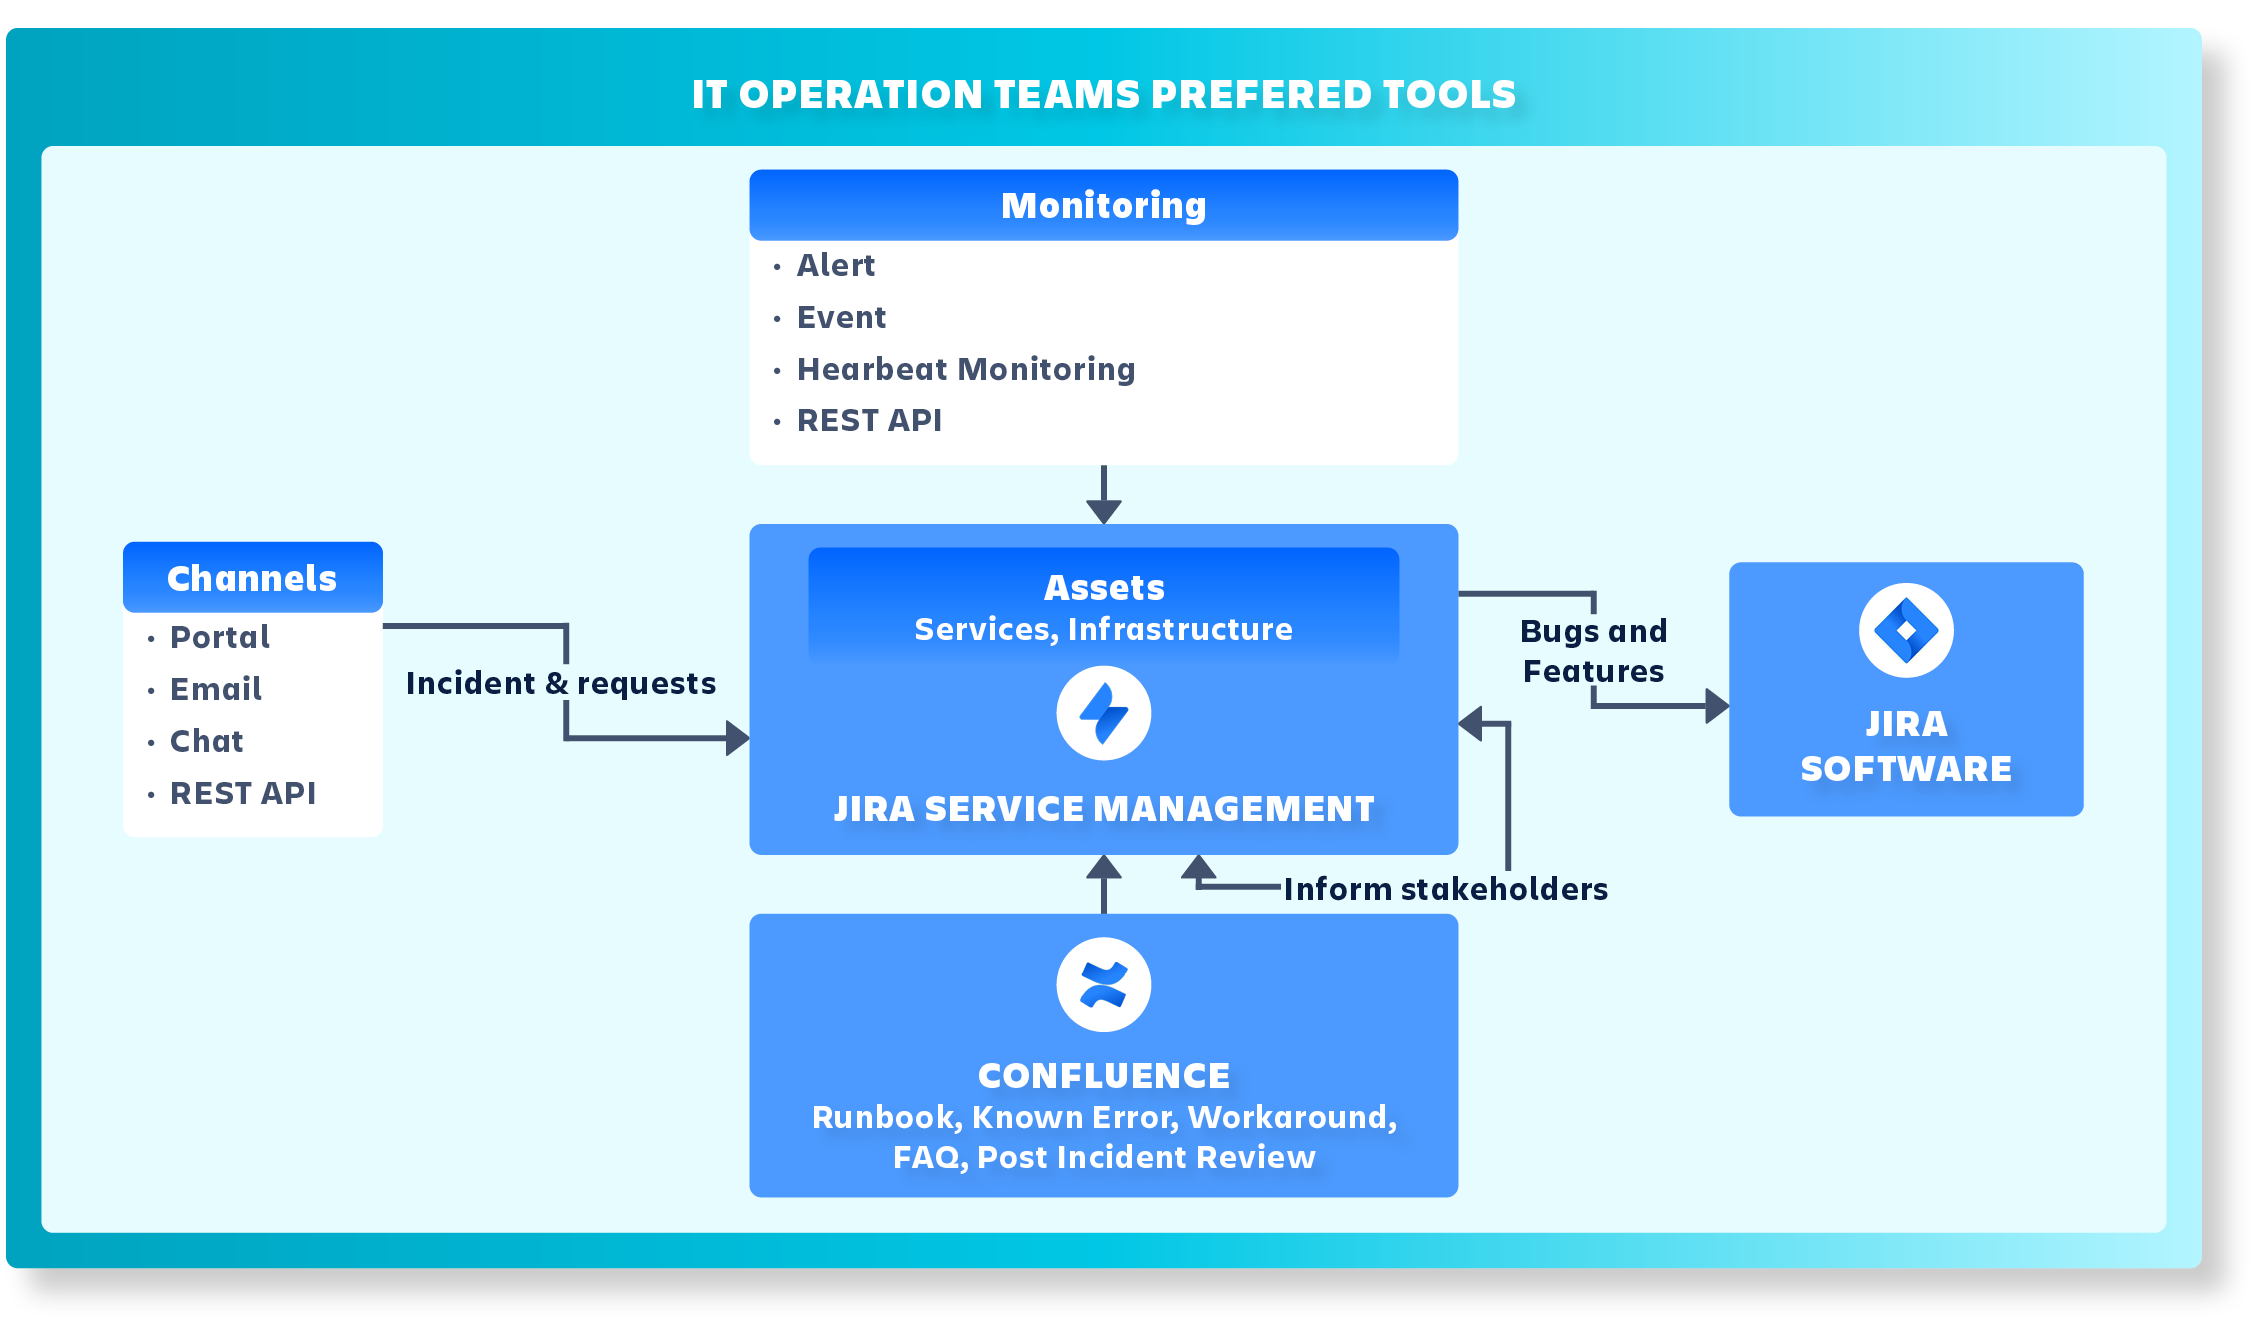
Jira Service Management for IT Operation teams brings the best functions that IT operations teams working on maintaining systems and services need.
IT Operation teams are often part of on-call schedules, to make sure that someone always responds quickly to incoming incidents.
They want communication to be automated or handled by designated incident managers to be able to focus on restoring services quickly.
It’s important to be able to detect degrading performance early, sometimes even before end users report incidents.
IT Operation teams working with JSM also need to escalate tickets to developer teams working in Jira Software. This gives full traceability of all the tickets in one place and allows for deeper analyzing and transparency for all collaborating teams.
Finally, IT Operation teams love to collaborate in Confluence and use it to document their Runbooks, Known Errors, PIR’s and FAQ’s.
The responsible On-call team is ready to acknowledge incoming alerts from Monitoring & Discovery tools as well as other incoming channels.
Critical alerts will automatically create incidents in JSM.
Bugs and feature requests can be created for the development teams in Jira Software.
Assets give additional context to tickets in JSM.
JSM informs stakeholders of incident updates and keeps track of the Service Level Agreements.
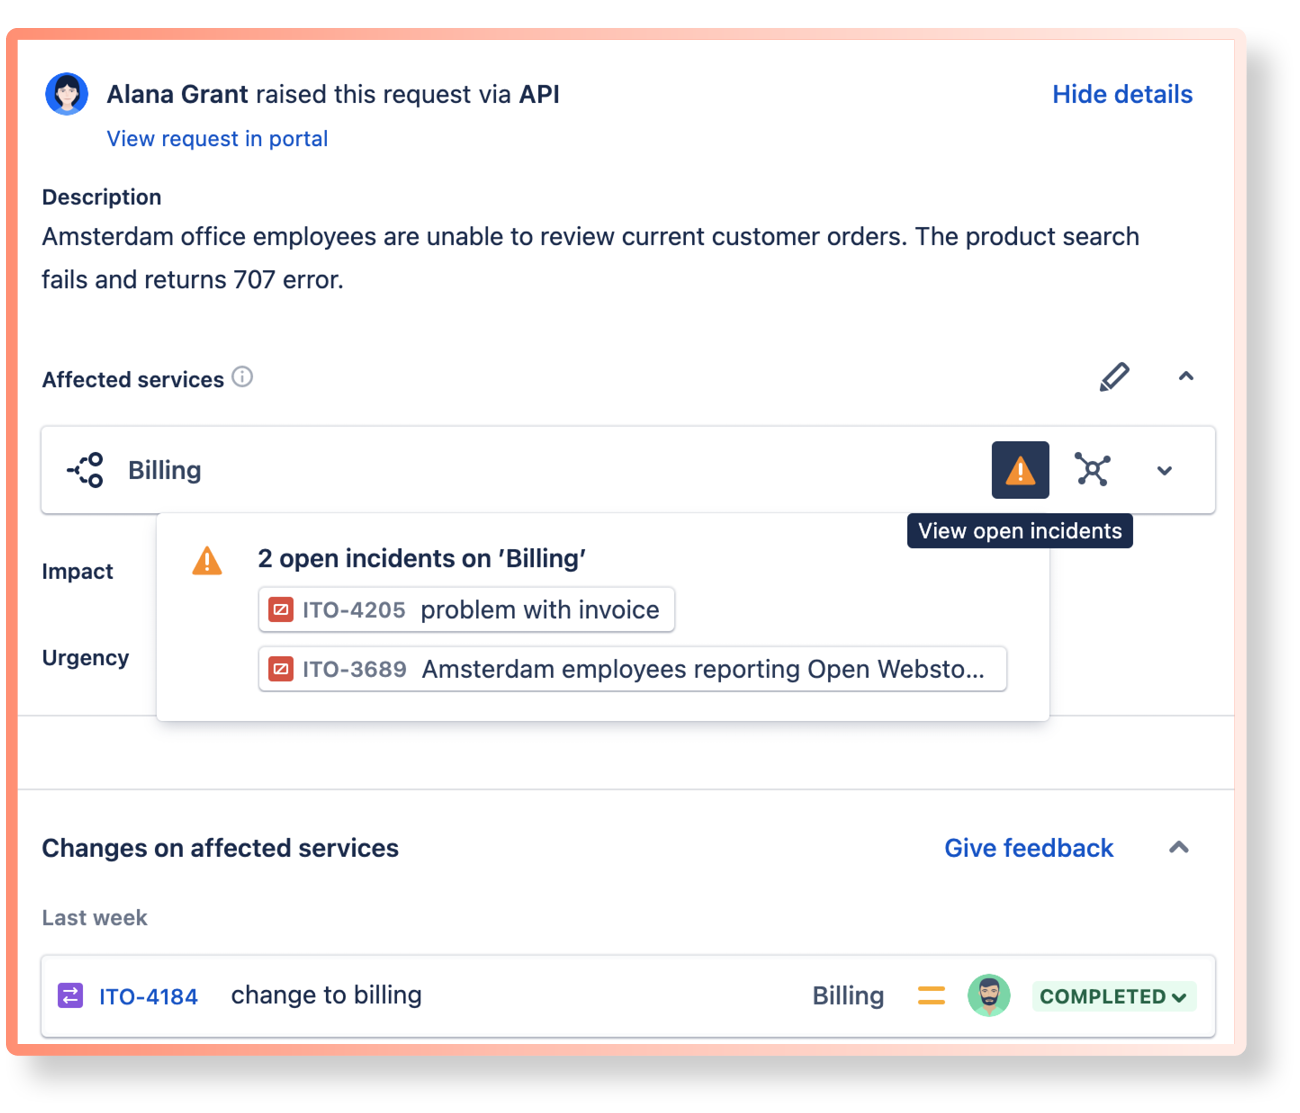
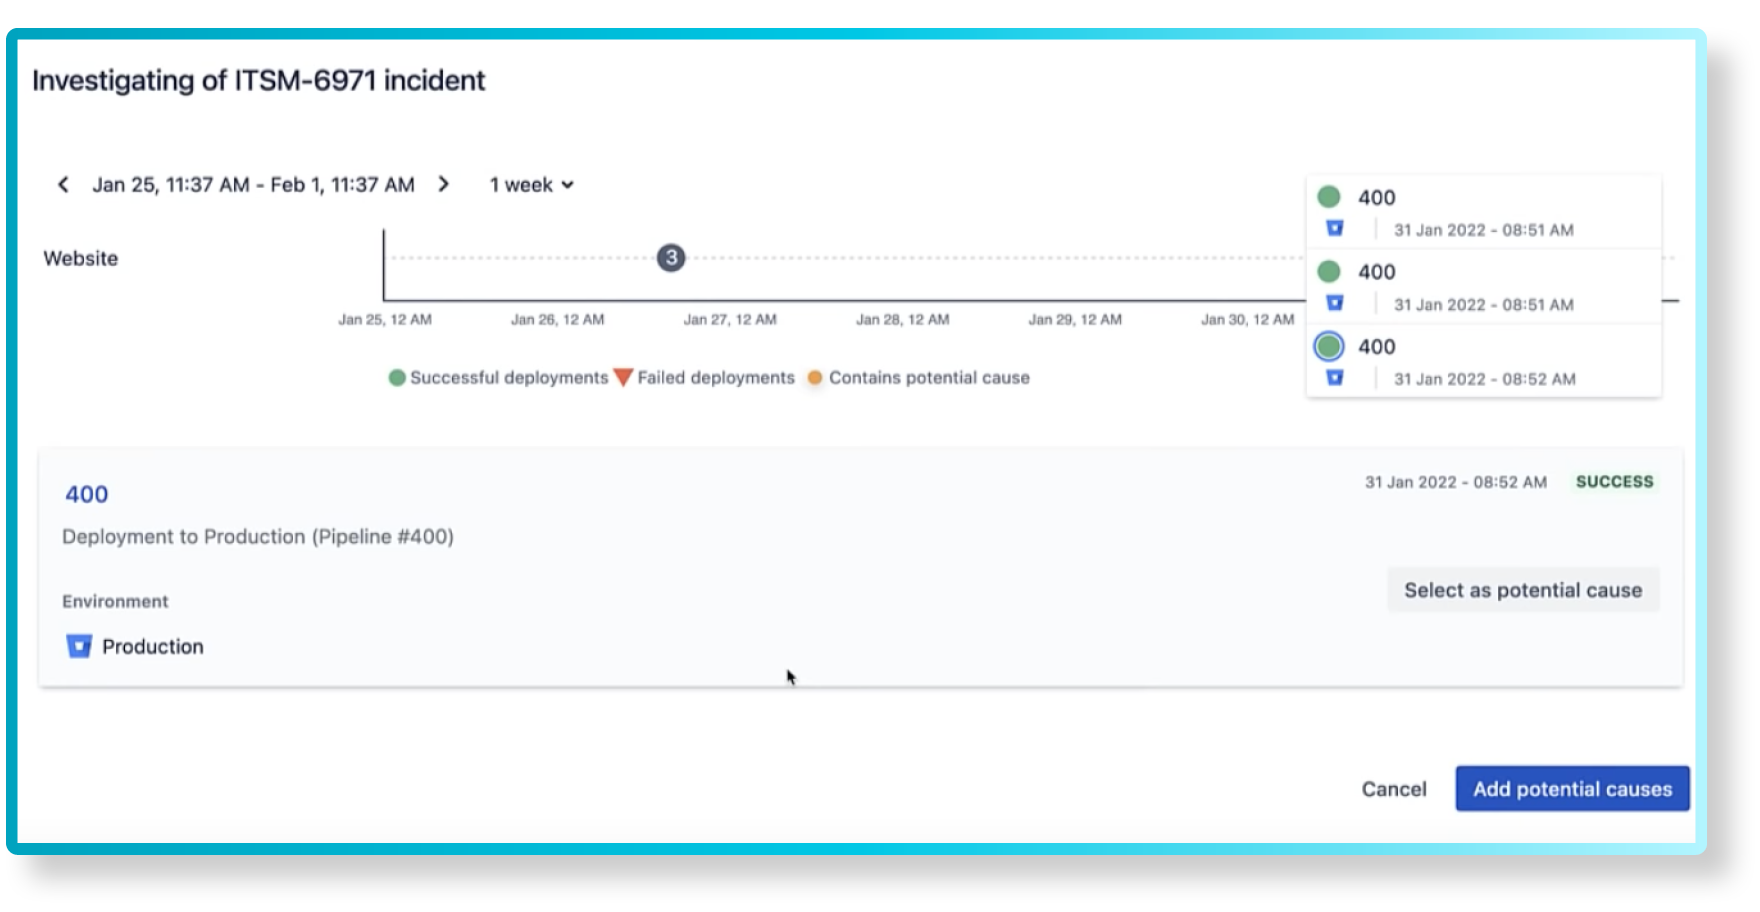
It’s also important to be able to identify potential causes for incidents to decrease the mean time to resolution. The screenshot below shows related incidents as well as recent changes to the affected service:
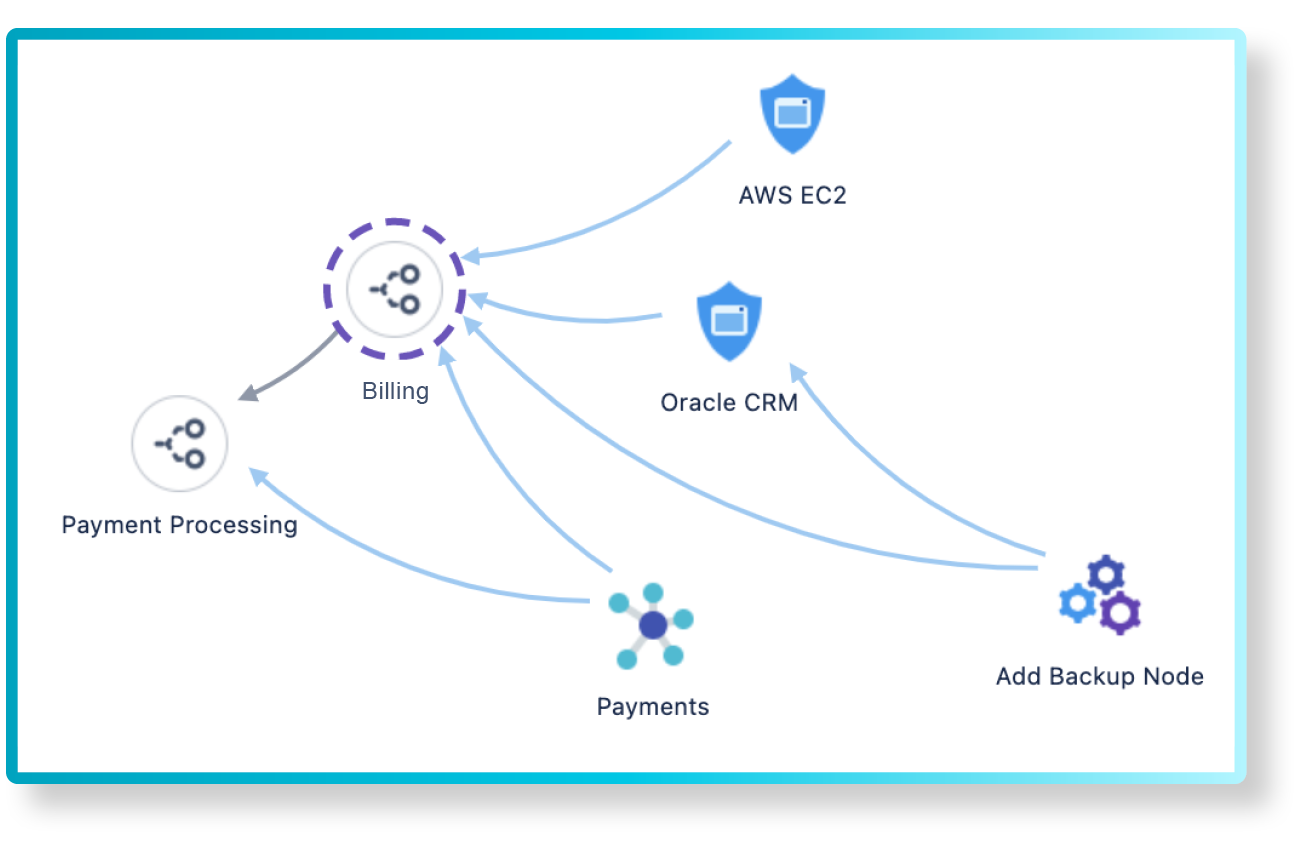
IT Operation teams also want to understand what other services or applications may be affected and we recommend looking at the Atlassian IT Asset Management - Solution Playto start implementing Asset and Configuration Management.
Classification and prioritization
IT Operation teams will need a clear definition of how to classify and prioritize incoming tickets. This will allow for JSM automations to be used and decrease the resolution time There are several ways to do this and we recommend reading through the Atlassian Incident Managementsolution play for more details on how to find the best solution for the organization you are working with.
For this solution, we will assume that the organization can categorize their incidents into affected services, impact and urgency.
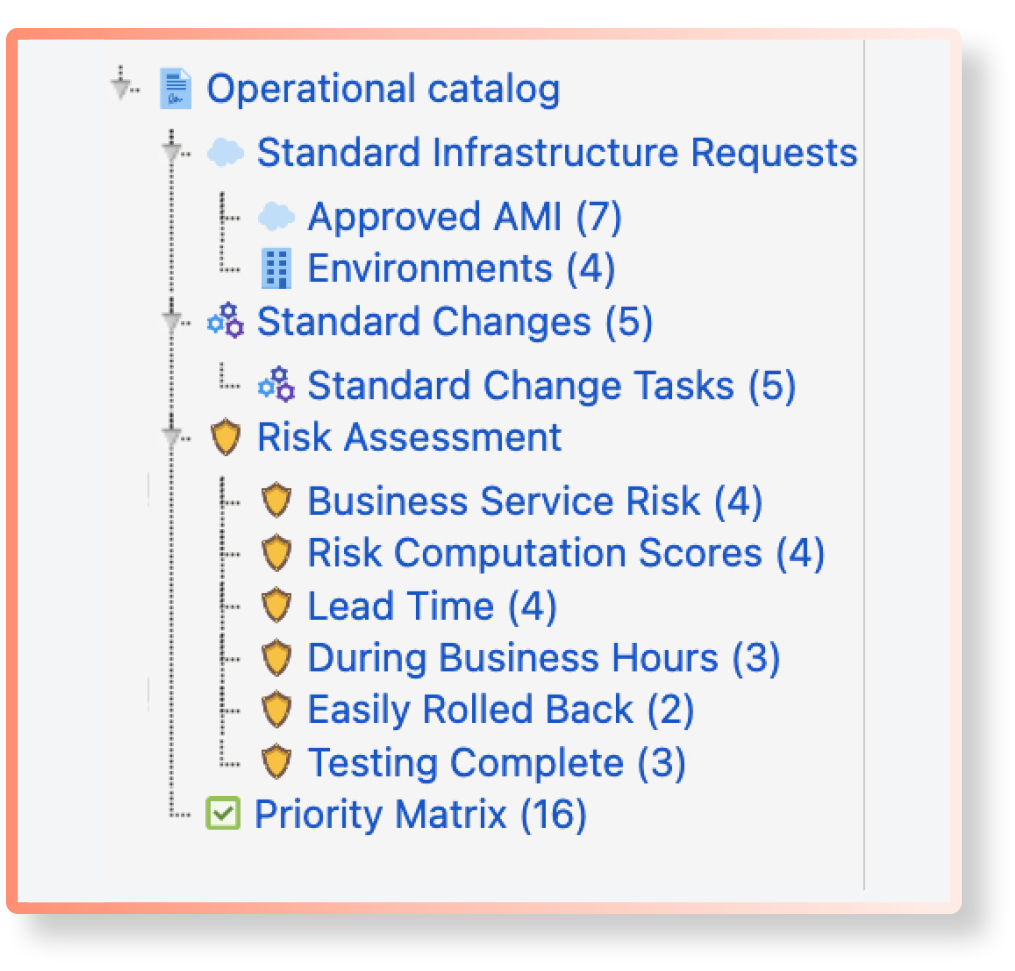
We recommend setting up an Assets schemathat contains your practice standards, here’s an example of how it could look:
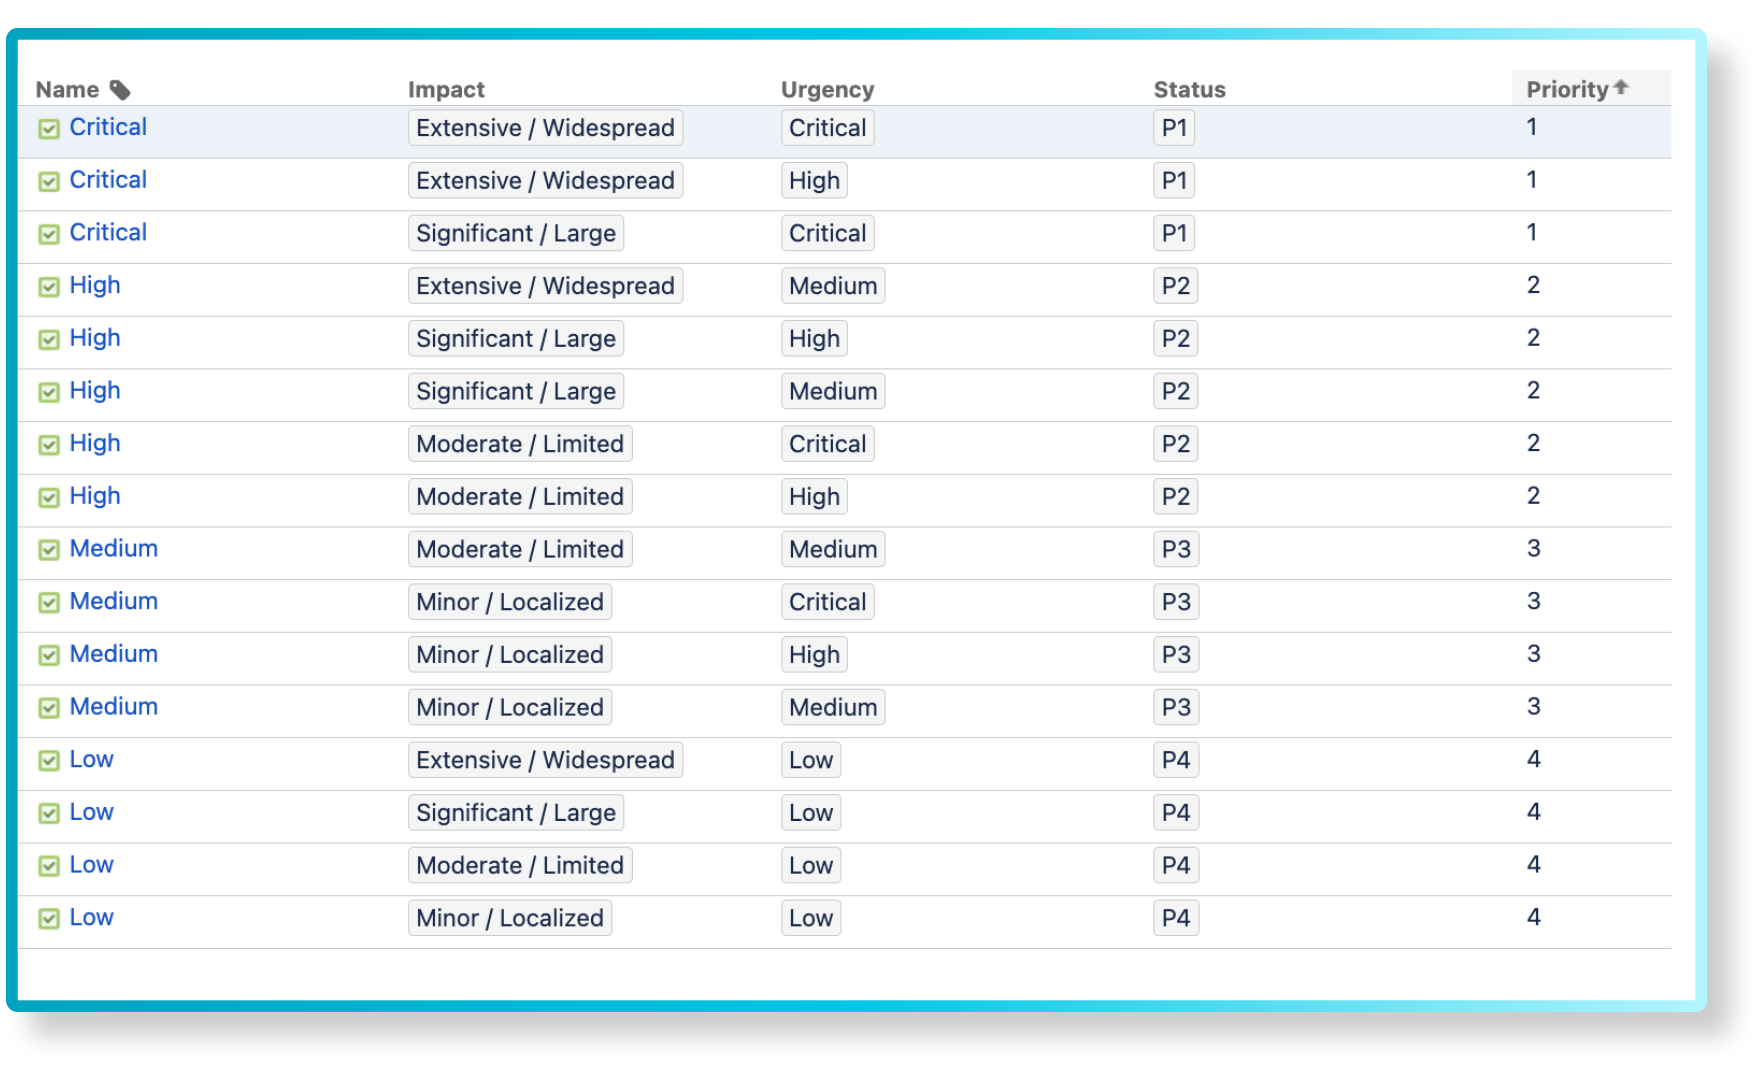
Define your priority matrix according to your organization standard, the impact and urgency will set a priority. Here’s an example of how it could look:
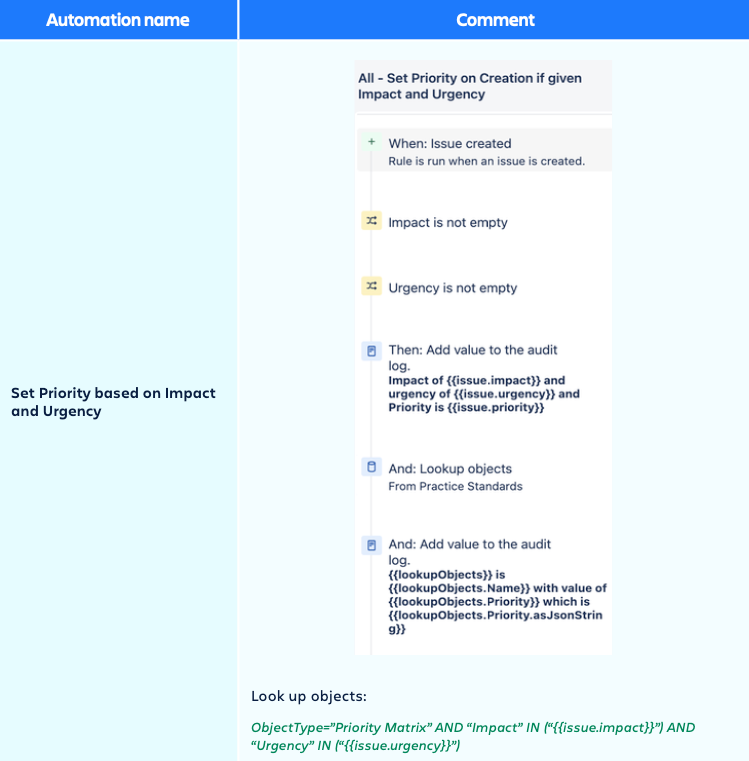
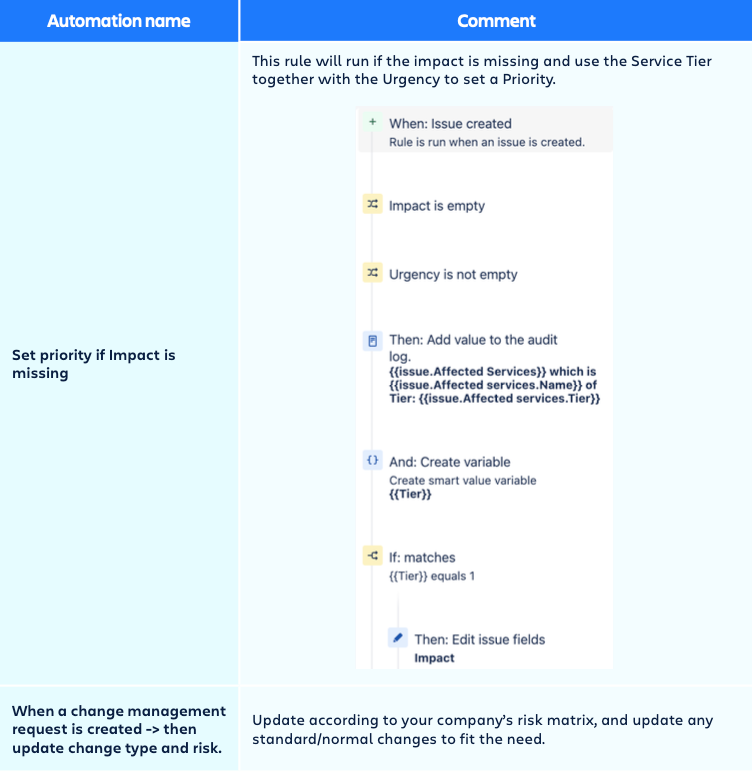
You can find examples on how to automate the priority for your tickets under the automation section in the admin configuration below.
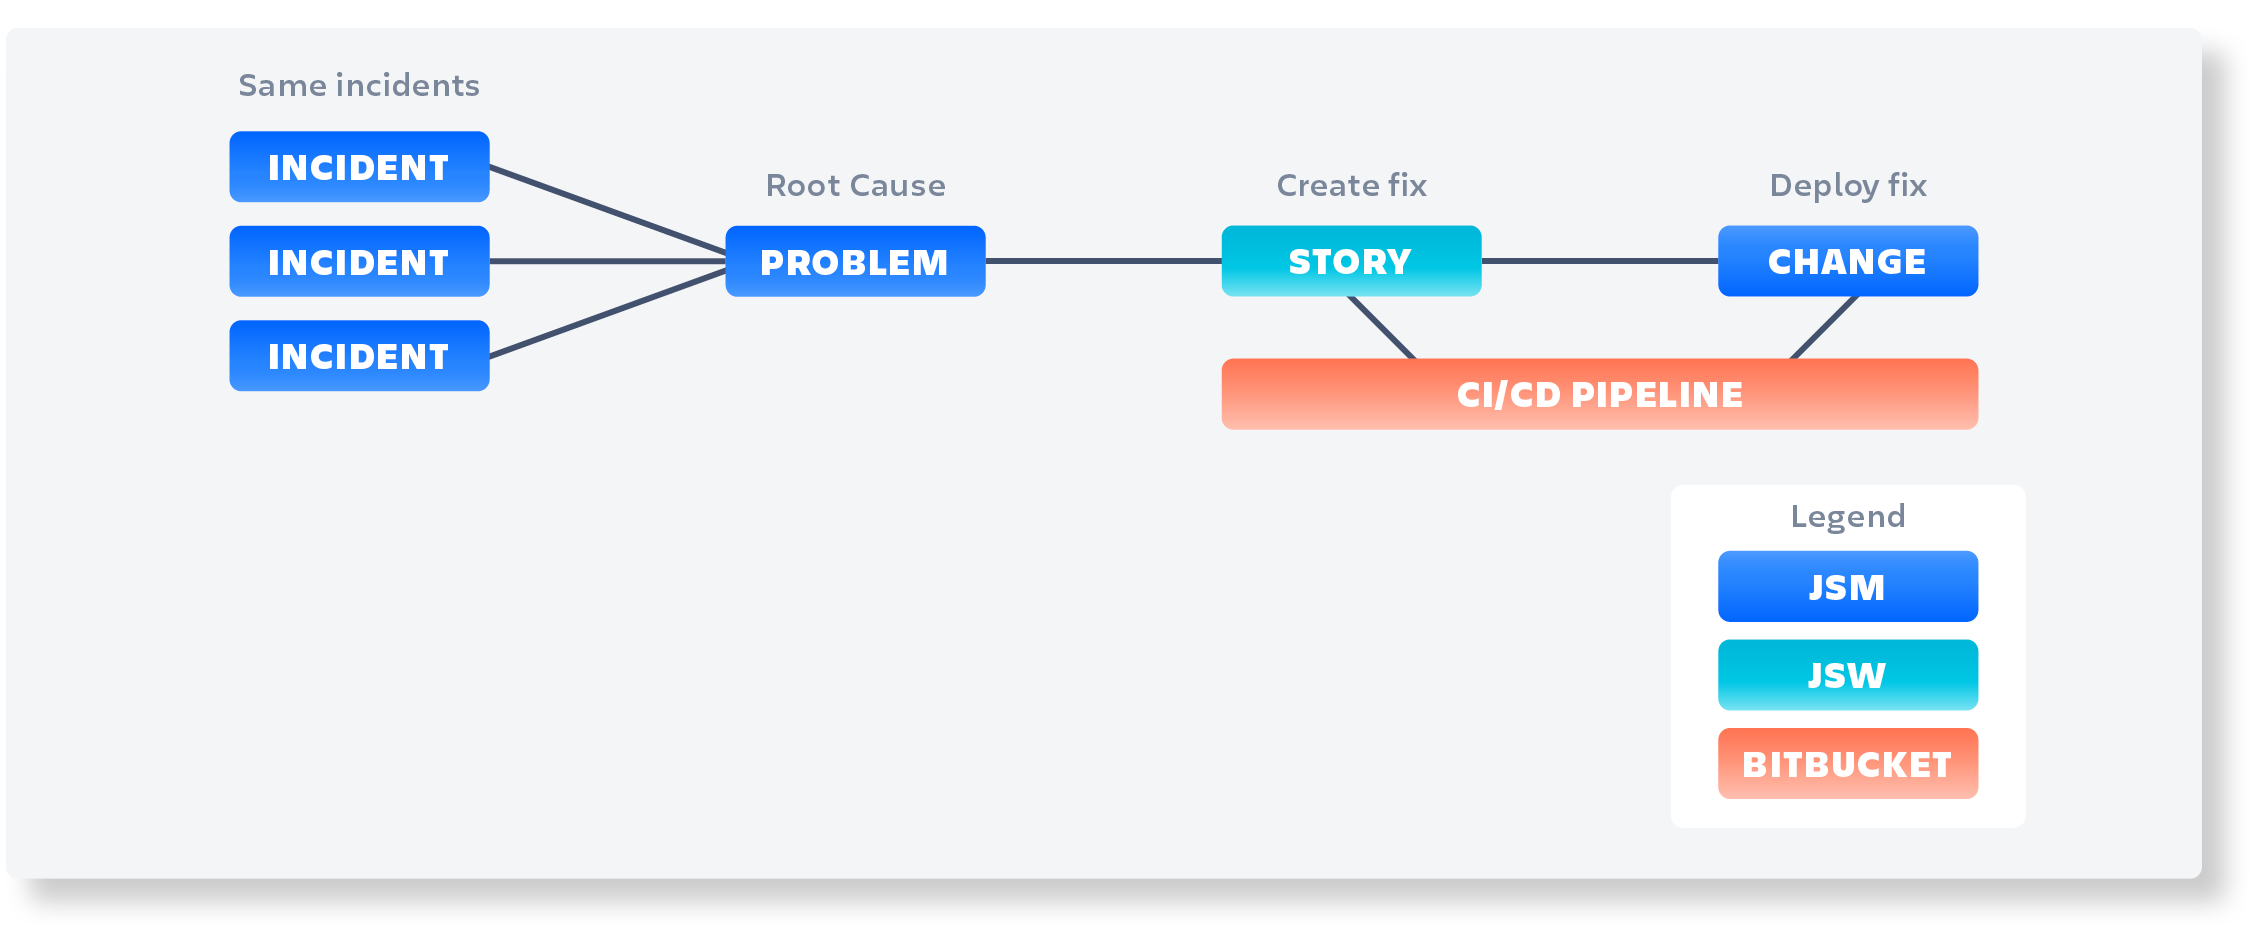
Incident, Problem and Change Management - how it all fits together
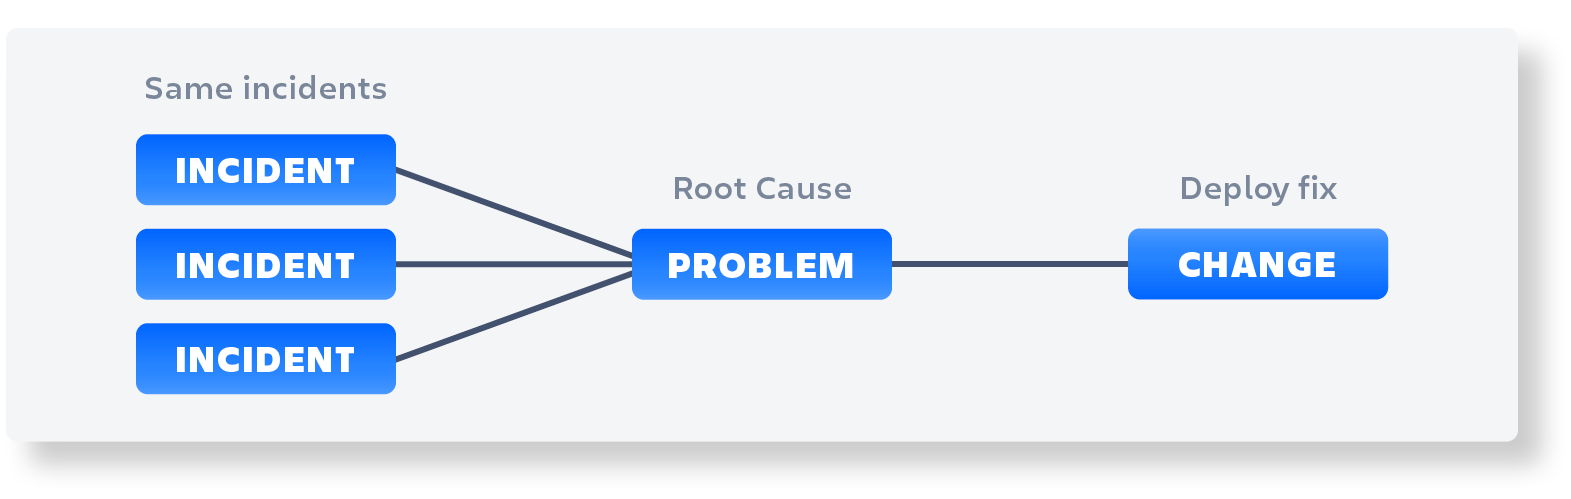
When an incident occurs, it is logged in JSM as an incident record. One or several incidents may result in the need to create a problem record, which is used to identify the root cause of the problem. The problem record is linked to the incident record, so that all related incidents are associated with the same problem record.
Once the problem record has been created, a team of experts will investigate the issue and identify the root cause. This information is documented in the problem record. The organization then needs to decide whether to implement a fix for the root cause or not. If the decision is made to fix the root cause, a Change Request is created to deploy the fix.
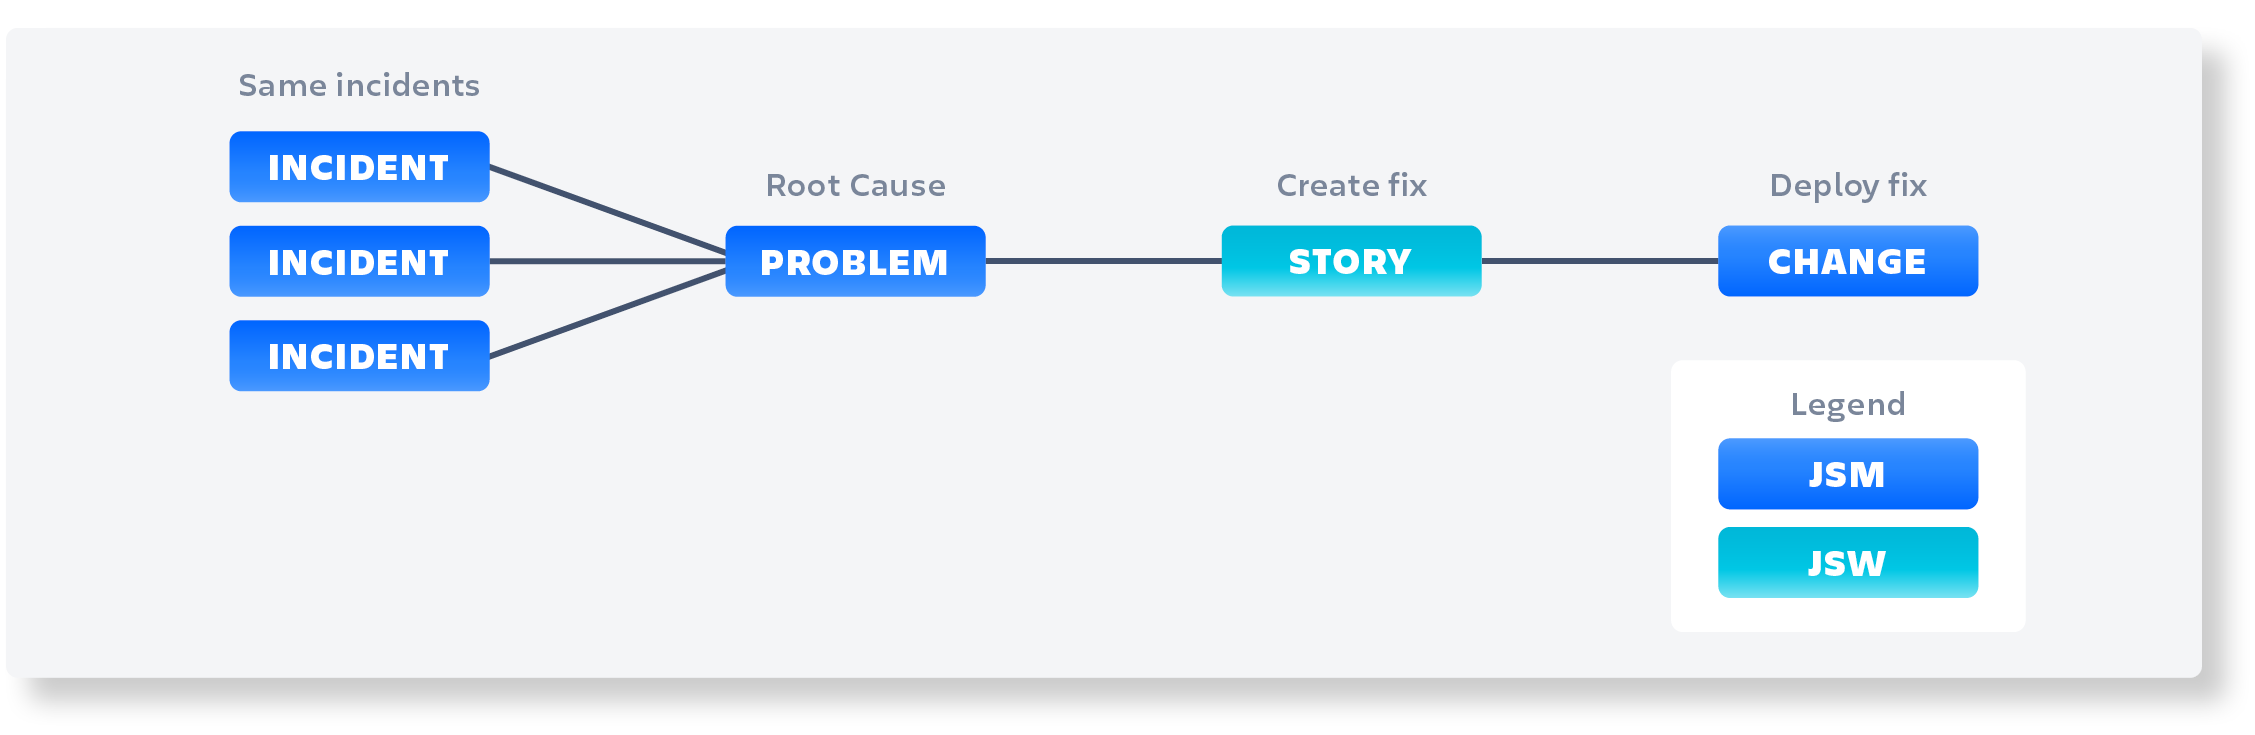
In some cases, the development team is involved in creating the fix. A Jira Software ticket is created to track the development work and is linked to the problem record and change request. This allows for traceability and ensures that all work related to the problem is captured in one place.
Once the fix has been deployed, the change request is closed, and the problem record is updated to reflect the resolution of the issue. If any related incidents remain open, they are linked to the problem record and are marked as resolved once the problem has been fixed.
JSM provides a comprehensive incident and problem management solution that enables organizations to efficiently identify and resolve issues. By linking incidents, problems, and changes, organizations can ensure that all related work is tracked and documented, allowing for better collaboration and more effective problem resolution.
Do you work with DevOps?
Now let’s take this a step further and describe how this works in a DevOps setup, where the culture has come a long way, and where you continuously deploy to production.
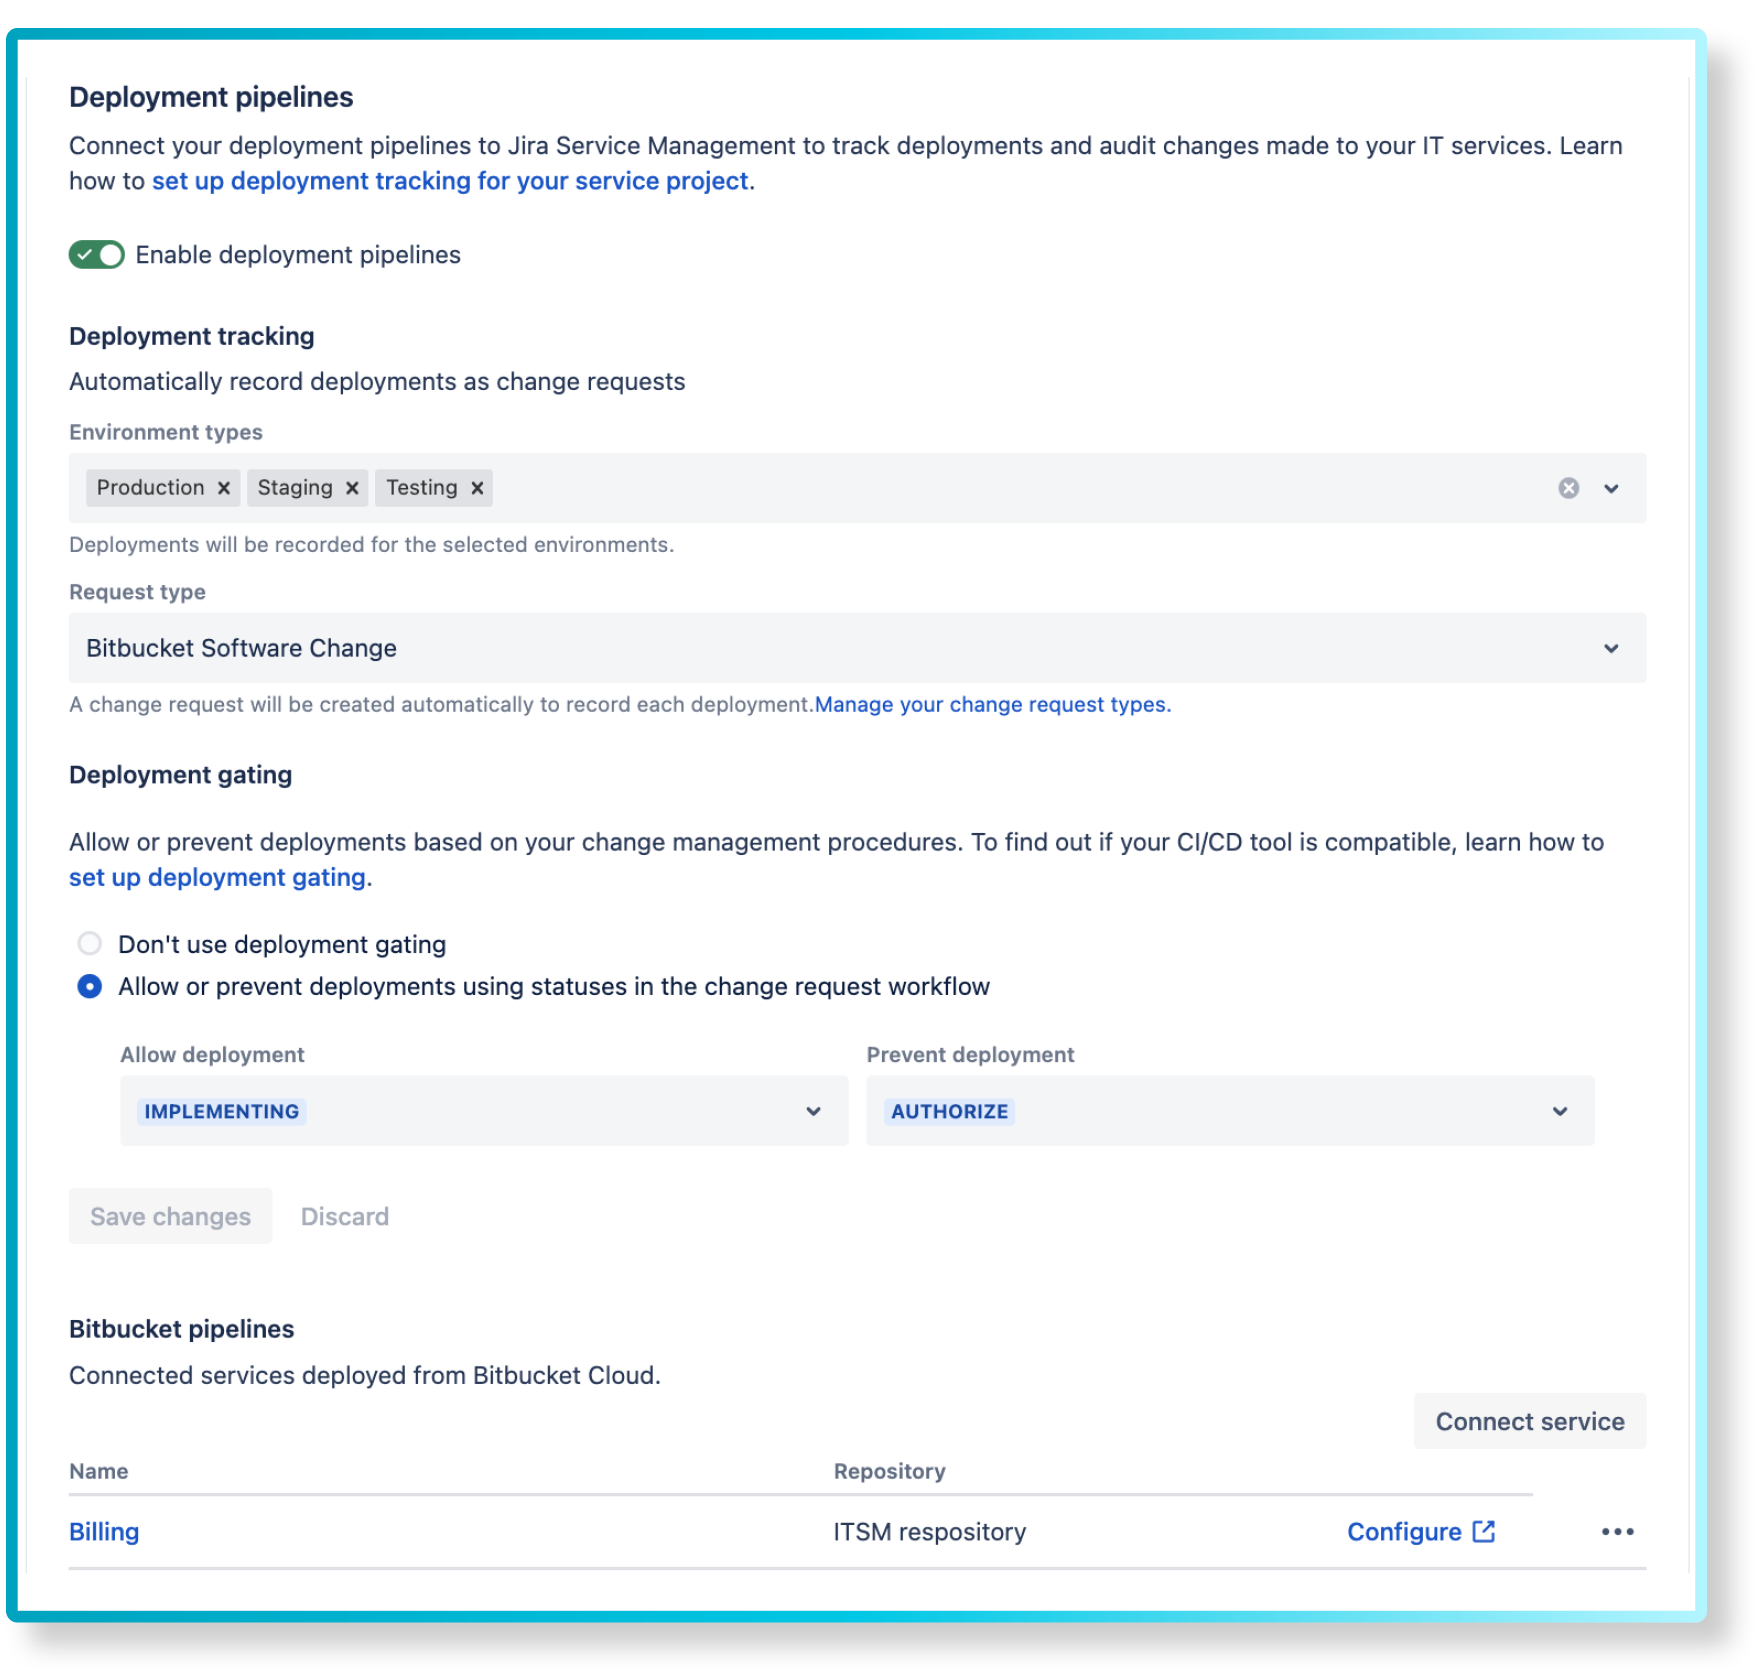
In a DevOps environment, it’s essential to have a streamlined CI/CD pipeline that automates the software delivery process and ensures that code changes are tested and deployed quickly and consistently. Tools such as Bitbucket, GitLab, or GitHub can be used to manage the source code and enable teams to collaborate effectively.
When a problem is identified in production, the DevOps team can use Jira Service Management to manage the incident and problem records, track the investigation, and identify the root cause of the issue. Once the root cause is identified, the team can create a change request to implement a fix.
The change request can then be managed through the CI/CD pipeline using tools such as Bitbucket, GitLab, or GitHub. The fix can be implemented in a feature branch, tested, and then merged into the main branch using a pull request.
If the tests pass, the code can be automatically deployed to the production environment using a CI/CD pipeline tool such as Jenkins or Bamboo. The change request can then be closed, and the problem record updated to reflect the resolution of the issue.
The supporting operations team can now see when the change was deployed in the investigation view:
Communication
You can add Statuspageto allow operations to focus on resolving incidents while the Statuspage keeps your users and stakeholders informed. We recommend having an Incident Manager responsible for the communication part.
We also recommend setting up respondersand stakeholdersfor your service. This allows the right people to get incident information at the right time.
If your organization gets a Major incident (Tier1, or if it affects several teams: Tier2), you may want to swarm, to get all hands on solving the incident as fast as possible, having the responders and stakeholders mapped will make it easy for you to add the right people to the incident conference call.
Continuous improvement
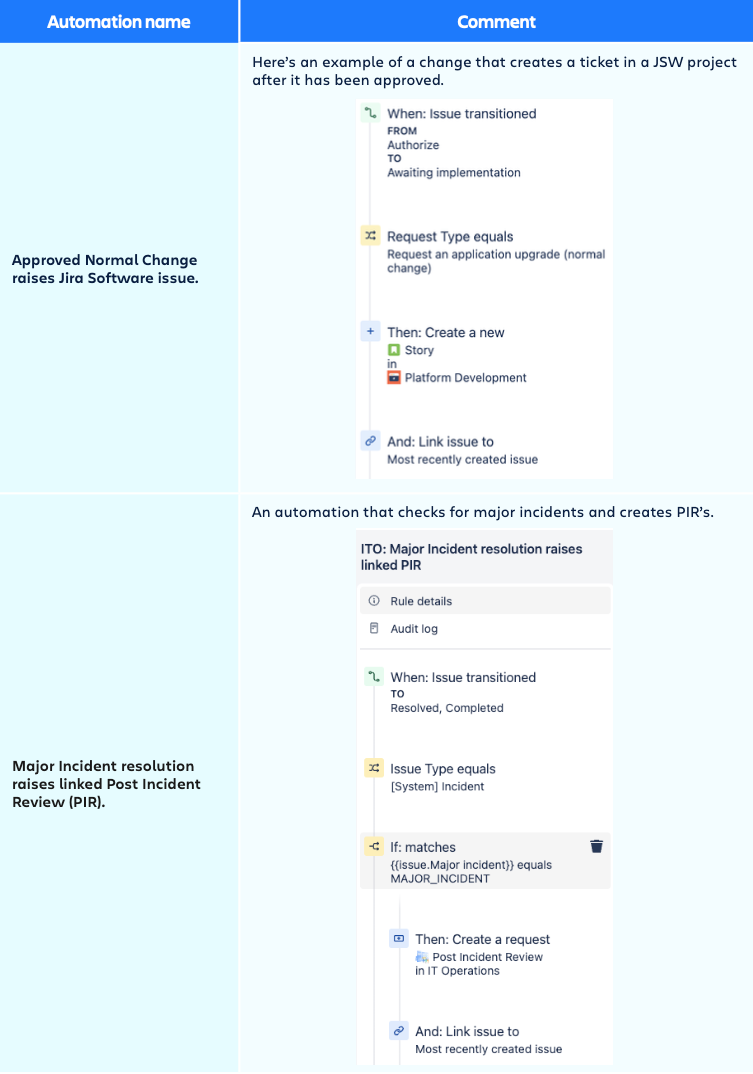
To prevent incidents from occurring, we recommend automating the Post Incident Review (PIR) creation for Major incidents and assign it to the Service owner with a reasonable SLA to make sure thePIR isn’t postponed on being handled. You can find examples of how to automate this under the automation section in the admin configuration below.
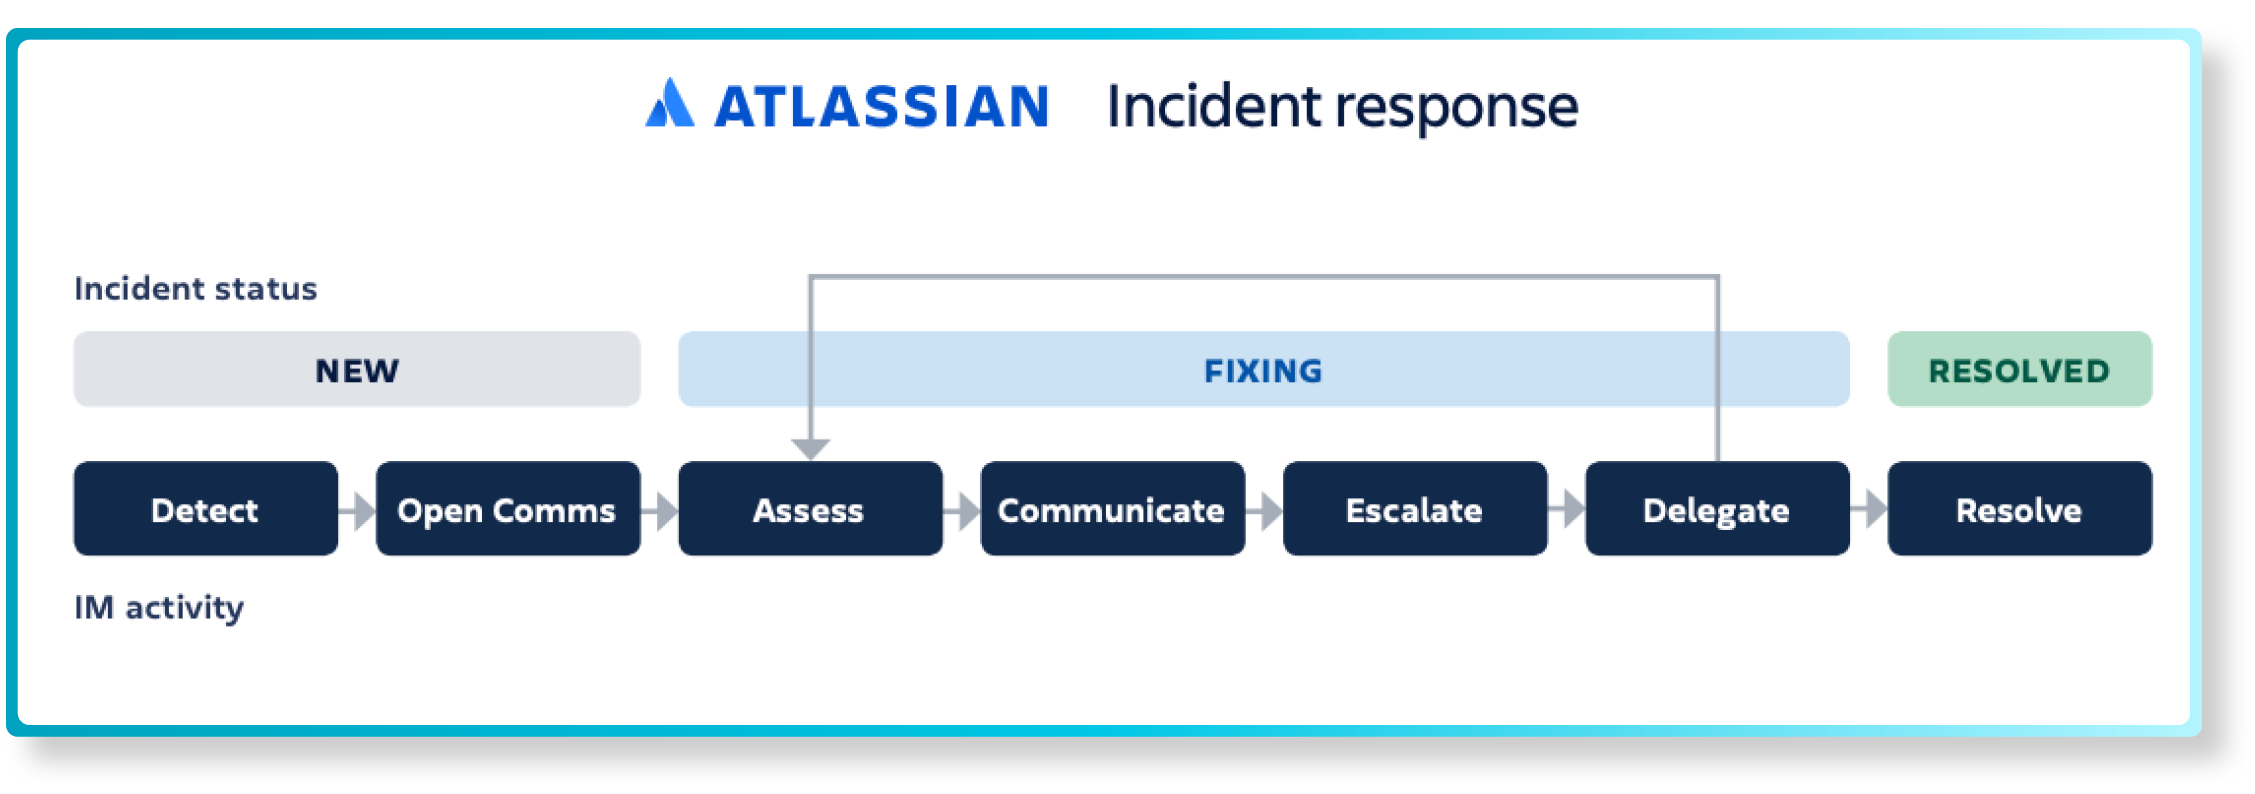
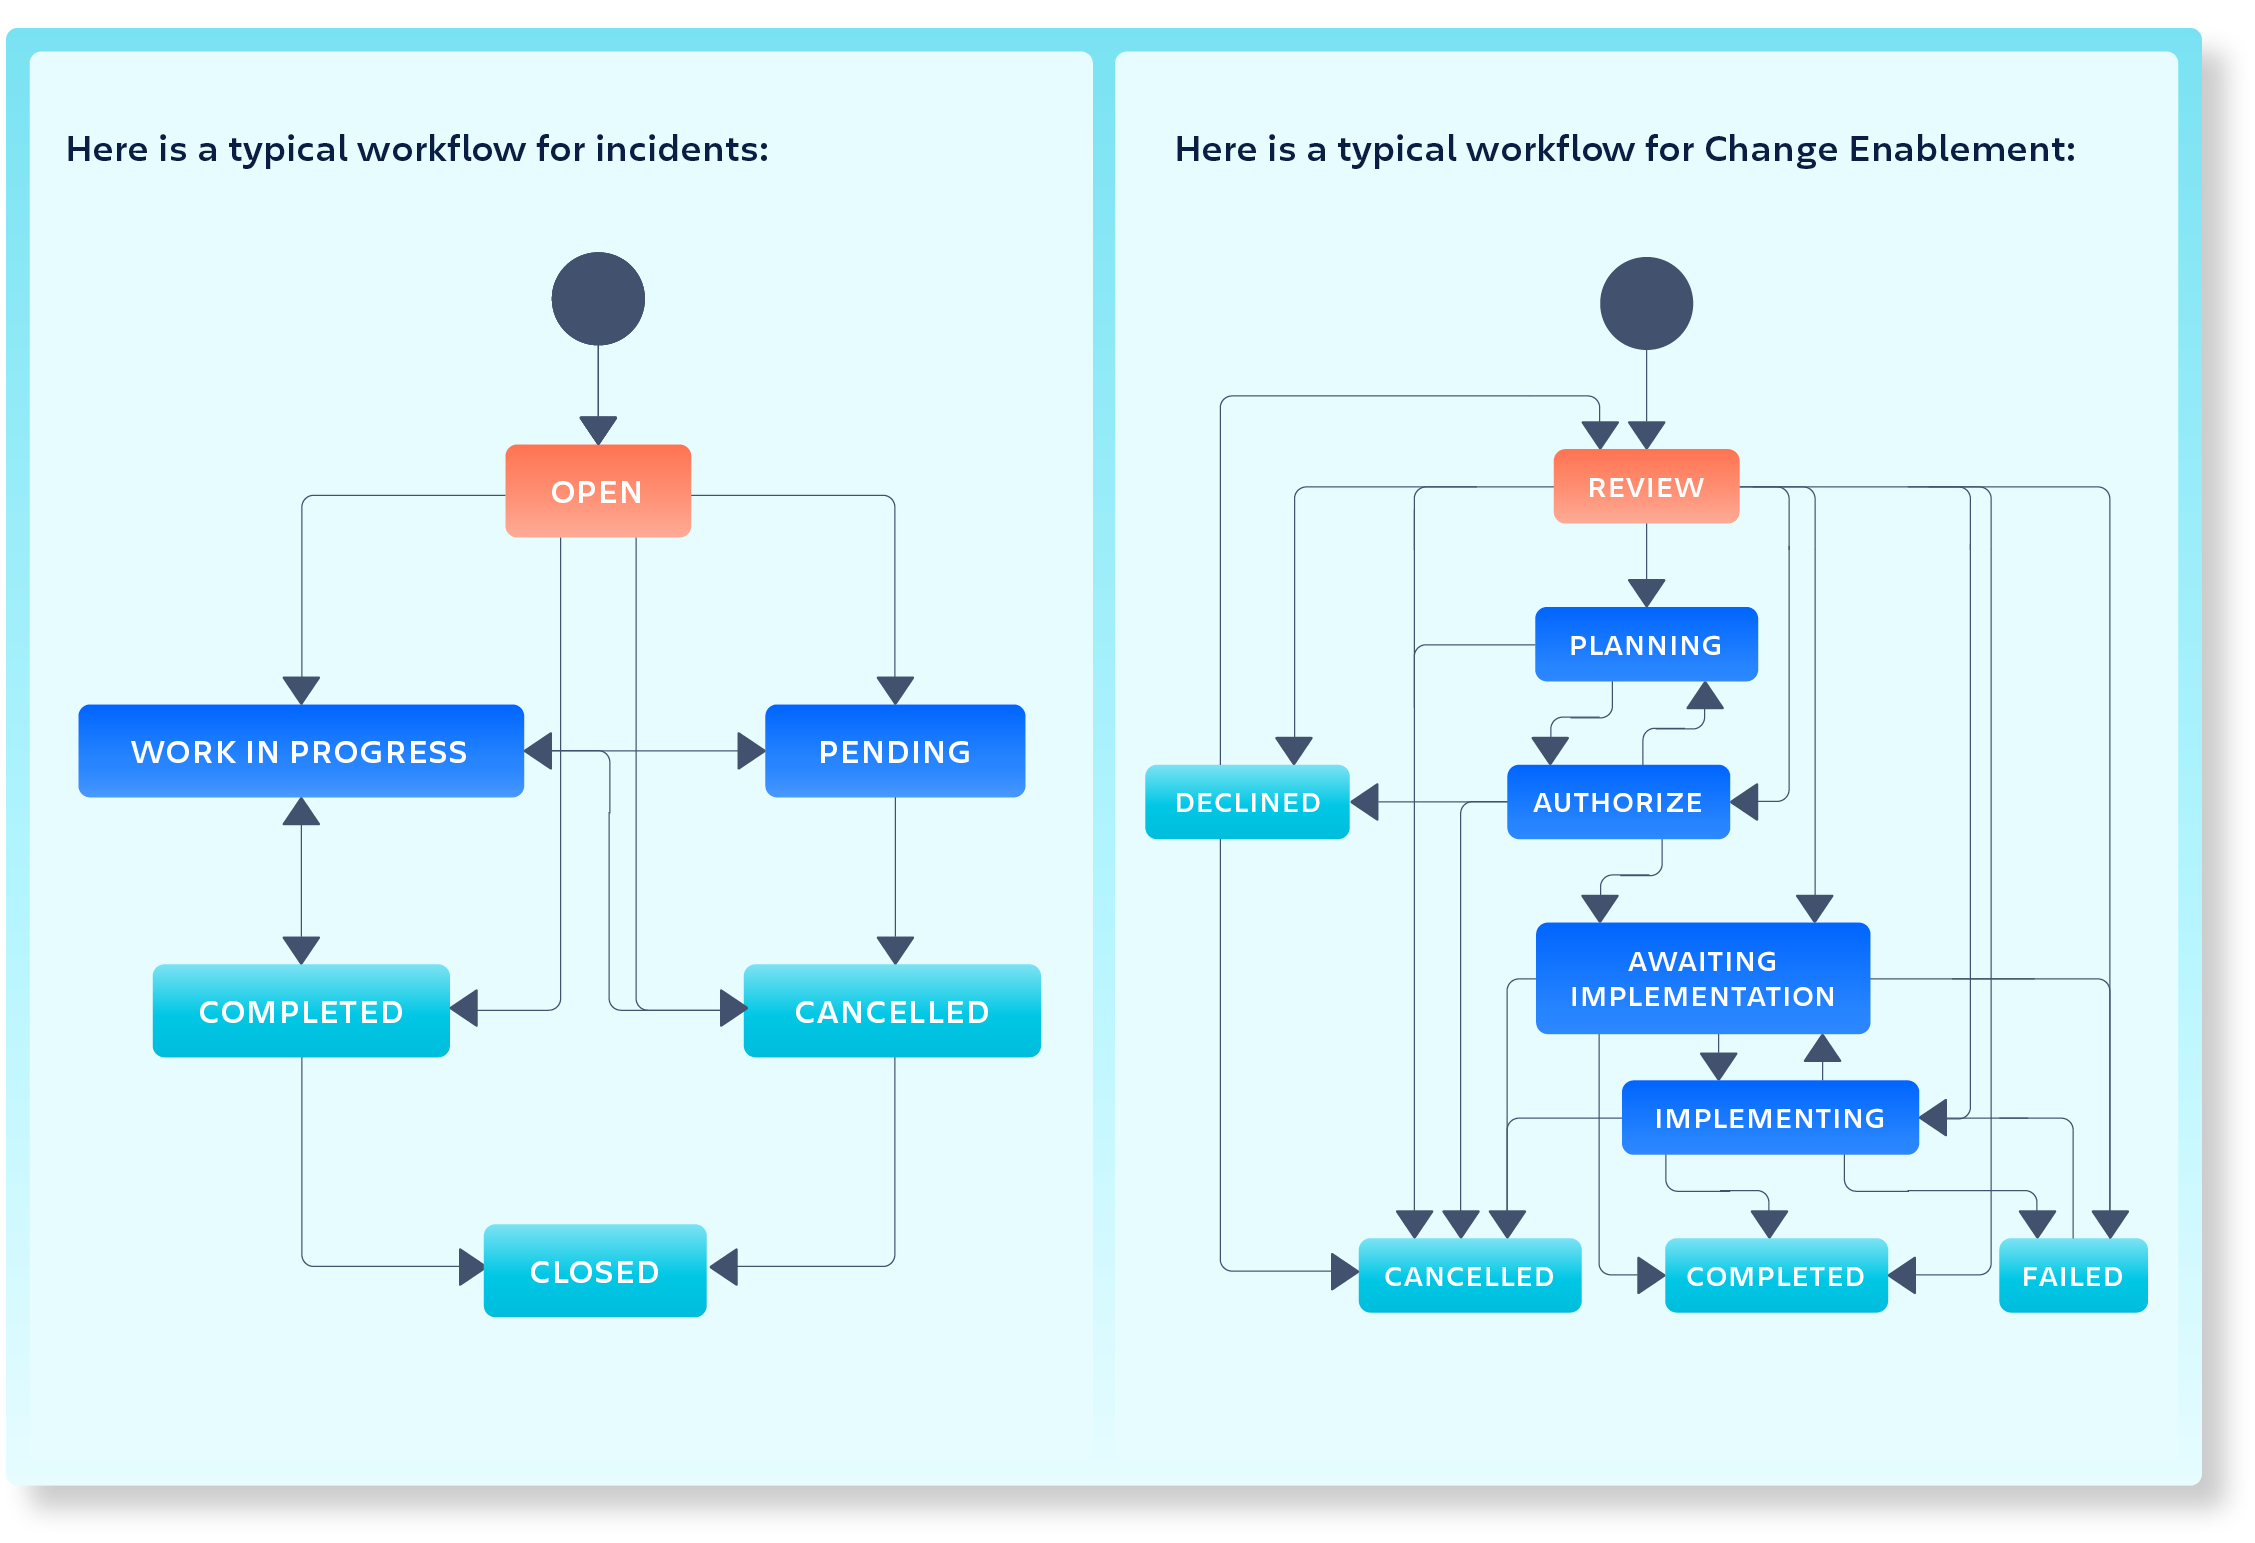
Incident workflow
Incidents are created from different channels and with the help of the Service Tieror the Impact set by the user together with the Urgency, the priority will be set automatically with the help of Jira Automations.
An Incident Manager notifies of an ongoing incident in Statuspage and creates an incident conference call for Major incidents.
Similar incidents affecting the same service are grouped automatically.
Identifying and analyzing the incident can be done with the help of the new Investigation view as well as analyzing the asset graph view to find possible related assets that could affect the service.
PIR’s are created automatically for Major incidents, but should be considered for other incidents as well.
Added value
Faster mean time to resolution (MTTR) by increasing visibility on what assets are affected or what recent changes have been made to the system or service.
Help with reviewing incidents and perform preventive actions, when needed, by using the built in Post Incident Review.
JSM for IT Operation teams facilitate early detection, and decreasing performance of services and systems, with alerts, events and heartbeats.
This makes your IT Operation teams shine by avoiding major incidents where possible.
The solution brings team communication through Conference calls or chat channels to resolve the incident faster (swarm).
Surface more context during incidents, to troubleshoot faster with Asset Management.
This is something that incident managers, stakeholders and IT operation teams really value.
JSM for IT Operation teams leads to faster Mean Time To Resolution (MTTR) by increasing visibility on what has been recently deployed, in the new investigation view.
Set up On-call teams. This is useful when dispatching to the right teams.
Go to your newly created project and click on Servicesto set up products or services that the IT operation teams are supporting. Make sure to add Tiers (Service Tier), Service Owners (Teams), Change approvers (Groups), Responders, Stakeholders and a Repository to your service.
Setup Queuesfor your project (In case you are missing the Major incident queue, you can add the following query: “Major incident” is not EMPTY and resolution is EMPTY)
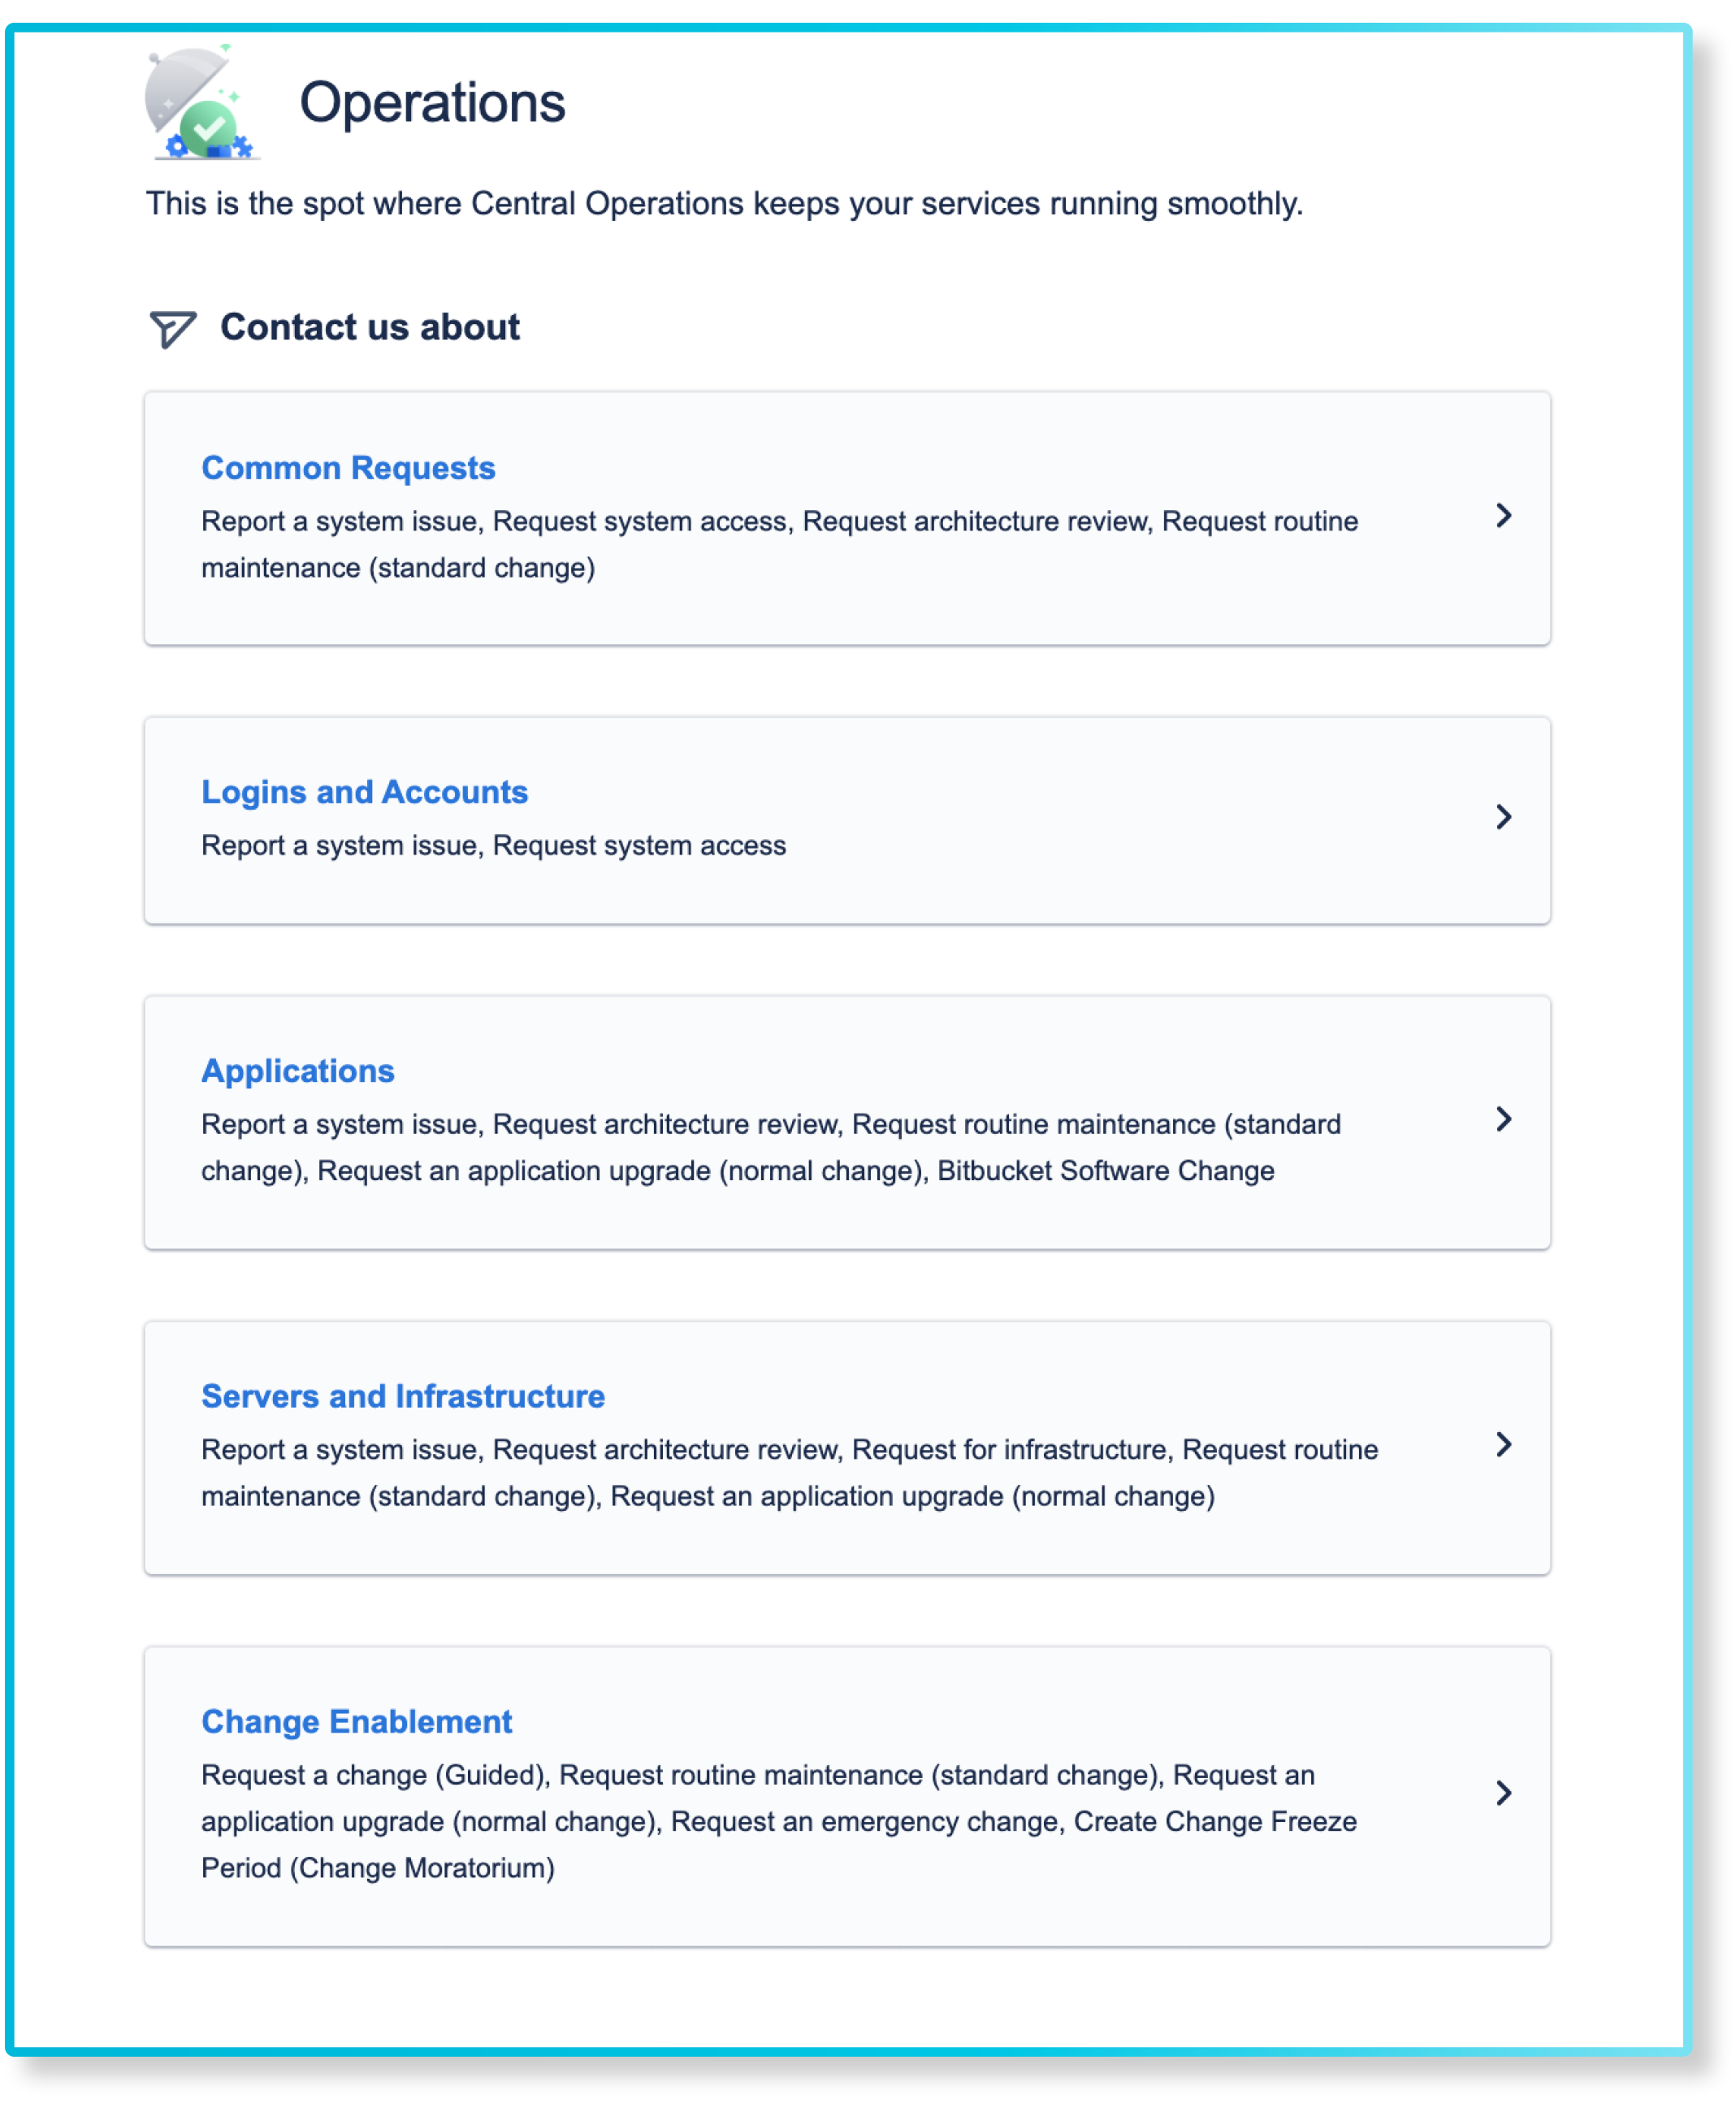
Configure the portal, make sure to group the request types into logical categories for your end users. Here is an example of how it can look like:
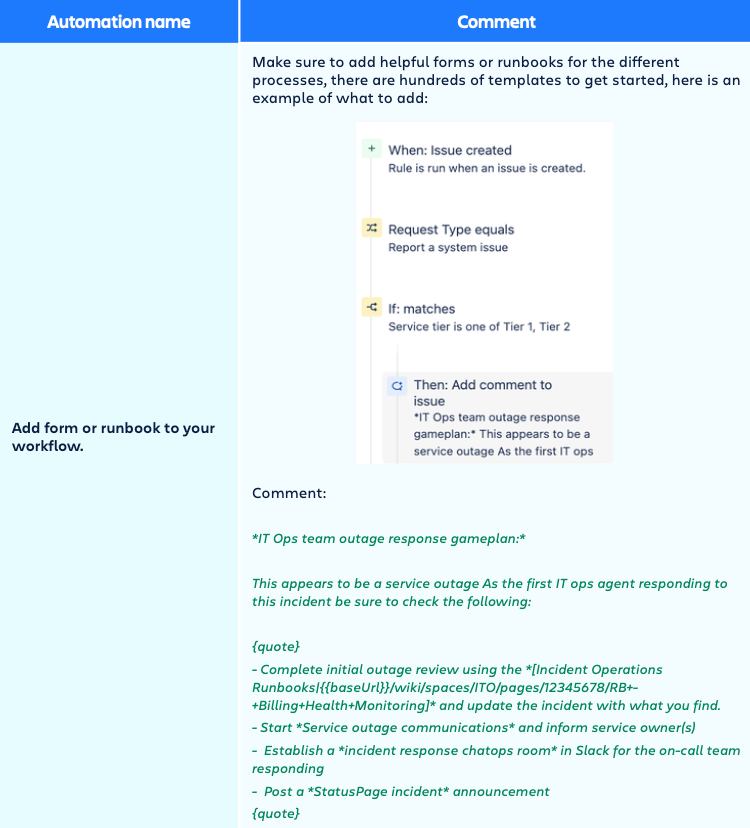
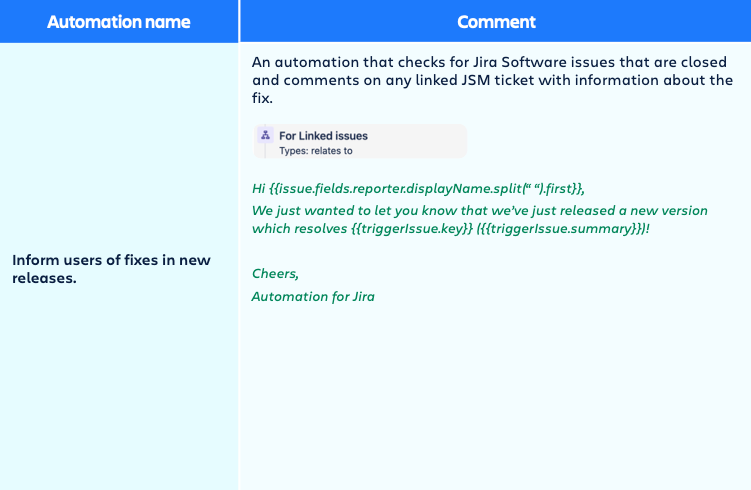
The template has some automations, however make sure to review them and adapt them to the need. See below for some examples.
Finally you can also consider setting up a mailboxfor incoming tickets.
Asset and Configuration Management
JSM Assets feature is a flexible datastore for powering up JSM workflows. It provides context to Incident and Change tickets. A few main topics to consider during the implementation can be listed as follows:
Finding correct people in the organization is possible by storing the organization related information in JSM Assets. (i.e. responsible, owner, support agent, approver, etc.)
Identify the master data source for employee related information. Look for HR systems, or Active Directories. Synchronize the employee, manager, department related information into JSM Assets.
Finding the impact of the incidents or dependencies of the planned changes is possible by collecting and aggregating all infrastructure related information into JSM Assets.
There may be multiple environments where the network components, servers, databases, applications, services are hosted. Review the IT infrastructure with the organisation’s Enterprise Architects and clarify which environments store valuable information for the incident and change processes. The infrastructure may be hosted in data centers, cloud based environments (i.e. AWS, Azure, GCP, etc) or both.
Look for opportunities to leverage existing information. IPAM systems, Network Scanners, Endpoint Management Solutions, Software Asset Management Solutions, Monitoring Solutions, Security Focused Solutions, and Cloud Service Provider solutions (i.e. AWS Config) commonly stores relevant data sets. The IT Operations team is generally the owner of these systems.
If there is no solid source of data available, or the existing system is not reliable, then Assets Discovery would help to scan the hosted networks and auto discover the resources. Following is the summary of the conditions where Assets Discoverywill be a good fit:
The organization has seen a demo of Assets Discovery and knows the structure and relationships that will be created automatically (Hosts, Applications, Operating Systems, Windows Licenses, IP Addresses, Patches etc.).
The organization has one or multiple data centers and there is no environment having the full resource list (or the existing systems are not trustable because they are not up to date).
The organization can provide the list of subnets to be scanned.
The organization can provide a Windows server for installing Assets Discovery. You may need multiple servers if there are multiple closed networks. Assets Discovery can horizontally scale by adding new Discovery Applications.
It is possible to connect (via WMI, SSH, or SNMP) and run commands on IP based systems (Windows servers, Linux Servers, Vmware Hosts, Network Switches, Firewalls, Routers, Load Balancers, IP Based Printers, IP Cameras).
The list of commands are reviewed by the organization’s security team and are approved.
The organization can provide credentials for these systems.
The organization allows Discovery Application to transfer the scan results to JSM Cloud Site.
In cases where a Discovery Application is not allowed to have direct access to the Internet, there is a DMZ for installing the Discovery Collector and DMZ has access to Internet.
If there are devices which are not always online (i.e. Windows laptops.) the organization has a way to install Discovery Agent to all such devices. And, agents will have access to the Discovery Application.
Daily imports are sufficient for keeping the data up to date.
There may be other requirements an organization can have such as:
There are enhanced network switches having clustering capabilities to be discovered.
Network mapping needs to be discovered at the port level.
Application dependency mapping needs to be discovered according to end user transactions.
Phones, tablets, Linux laptops, or Macbooks need to be discovered.
They use cloud environments (i.e. AWS, Azure, GCP ...)
There is a need for a full list of Licenses to be discovered (Oracle, Microsoft, Vmware, etc.).
There is a need to collect licensing information for SaaS applications (Atlassian, Salesforce, Workday,etc.).
Data needs to be updated near real time.
Then follow these steps:
Check if the organization has existing systems to collect device related information (i.e. SCCM, JAMF, Intune, AWS, Azure, USU, Device42, Snow Software, Monitoring Systems etc.).
Check the marketplace for an integration product and use.
Develop a custom integration using the Import API of JSM Assets and synchronize data periodically.
Mapping Logical Definitions with IT resources will allow notifying stakeholders at the right time.
Every organization may be using different terminology for defining important logical groups. Some examples are:
Business Services
Business Capabilities
Business Applications
Products
Technical Services
IT Components, etc.
JSM Assets feature allows creation of these or other definitions freely and mapping them to the IT resources as it is used in the organization. With the help of these definitions, dependency mapping or impact analysis can be executed by Automation Rules and notifications can be sent to the stakeholders (Operations Teams, Service Owners, and others) even without the need of human interaction.
Proactive operational activities can be planned and performed with the help of date related information stored in JSM Assets.
The set up of automated change management tasks for periodic operational activities (renewals of security certificates or software licenses) will ensure that there are no unplanned downtimes or service outages due to the data in control. Cloud Automation can trigger scheduled rule executions and search expiring certificates/licenses and assign them to the correct people in the organization.
Following the Zero Trust model will decrease the risk by allowing only necessary access permissions to the teams.
Decide on the number of Object Schemas and the read or write permissions according to the responsibilities of teams or people. For example, if the SRE (Site Reliability Engineers) team needs to access the AWS resource information while they are not allowed to view the on premise data center resources, then these data types can be stored in different Object Schemas in Asset and only related teams can be set as viewer or editor.
Review the Atlassian’s IT asset and service configuration management handbookfor more details.
Building up the asset and configuration management for the IT Operations Team requires following best practices. One major decision point is agreeing on the right level of details to be stored in JSM Assets. The recommended golden rule is to make sure that every imported dataset enables a use case for the IT Operations team either in the scope of the incident management or change management practice. If there is no supported use case, then the best decision is keeping it out of the scope. Review the guideto configuration management databases (CMDBs).
Assets admin configuration
Go to Assets and create an Infrastructure schema (one or multiple depending on the full picture)
Search for Integration applications in the Atlassian Marketplace for the data sources you have identified.
Alternatively, use Assets Import API for developing your own custom integration for your organization and define External Import.
Select an import type to import assets to your new schema. Typically daily import frequency should be enough for most use cases.
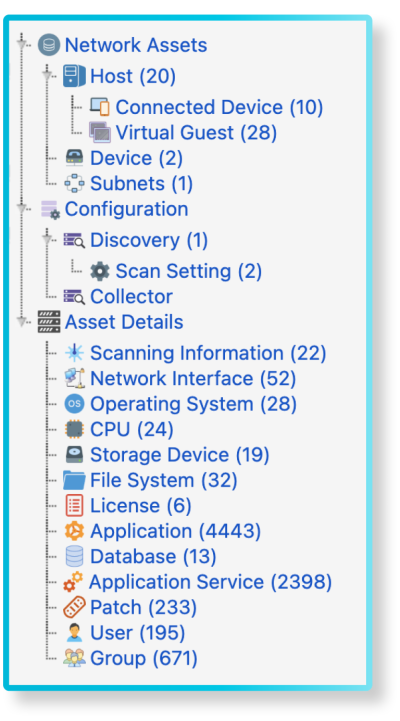
If you use the Asset Discovery scanner, you will get the predefined structure for your infrastructure assets. The scan results will be imported automatically:
Create Asset-related automations to improve your ITSM processes.
Automations
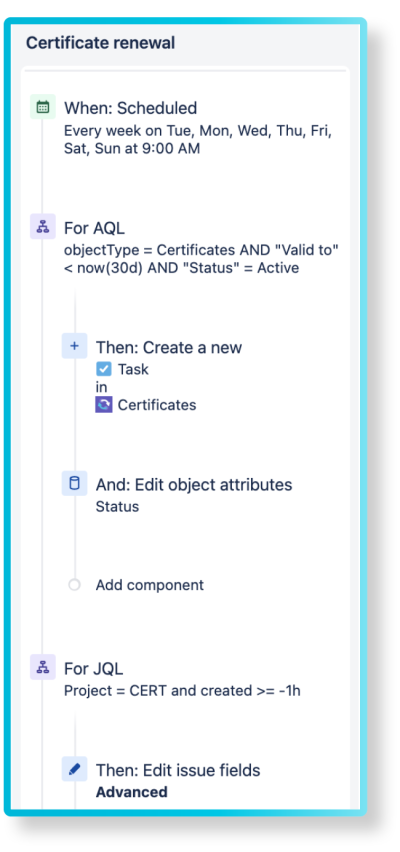
You can use Jira Automationsto enhance your processes. For example, you can create a Jira ticket that reminds you that a certificate (in Assets) is about to expire:
Additional tips and tricks
We have just implemented IT Operations management, but the journey for continuous improvement doesn’t have to end here!
Here are some tips and tricks to improve your solution further.
Alerts
Organizations may sometimes already be using other Alert & On-call management tools like Pagerduty and it’s possible to integrateJSM with those tools, however there are many benefits from moving over to JSM and using the full capabilities. Some examples are:
Easy to use, Alert and Event management which comes out of the box with JSM.
You will have an end to end solution that ensures your teams are responding quickly as well as keeping organization informed of changes. Most importantly, you can track all follow-up tasks to ensure that the right preventive actions are made.
As organizations are getting more complex infrastructure environments with potentially huge (and ever-increasing) volumes of data, we see an increasing demand for AIOPS and our take is that it can be really useful to optimize the IT operations.
AIOps can analyze large volumes of data from multiple sources in real-time and identify patterns and anomalies that human operators might miss. This enables IT teams to identify and resolve issues quickly, often before they impact the end-users.
AIOps intelligently analyzes alerts and events and identifies significant patterns related to application performance and availability issues out of the “noise”.
We see tools like Dynatrace being used for this and you can easily integratethese tools with Jira Service Management.
Atlassian uses machine learning “smarts” to identify collaborators and reduce repetitive tasks and this can save a lot of time and frustration as your teams are collaborating in the tools.
Some examples are:
Predictive user mentions
Ticket assignment
Pull request reviewers
Clustering similar tickets
Predictive labels
Atlassian Analytics and Data Lake (Enterprise subscription only)
Atlassian analyticsis designed to help businesses gather insights from their data and make informed decisions based on the data collected.
It provides a range of analytics tools, including dashboards, reports, and custom metrics and it integrates with external data sources.
We recommend using Atlassian Analytics whenever you need to get a holistic view on your teams and their productivity, when you need to identify areas of improvement and when you want to track key performance indicators (KPIs) across the whole organization.
Here are some examples of when Atlassian Analytics is useful:
Project management
Track project progress and identify bottlenecks in the development process. This can help teams to optimize their workflows and improve their efficiency.
Collaboration
Track team collaboration and identify areas where communication can be improved. This can help teams to work more effectively together and achieve their goals more quickly.
Service management
Track service performance and identify areas where service levels can be improved. This can help businesses to provide better customer service and improve customer satisfaction.
Software development
Track software development metrics, such as code quality, testing coverage, and deployment frequency. This can help teams to improve the quality of their code and deliver software more quickly.
You can use Atlassian Data Laketo get a comprehensive and holistic view across your toolchain with easy access to data across your Atlassian products and instances. This is specially useful if you have several sites or external tools and makes it easy to consolidate the data into one place.
You can also choose what data to include and remove unnecessary user-generated content, so that you can focus on the analysis of the data instead.
License improvement
To improve license usage of JSM and JSW, you should create predefined permission templates that can be used to easily collaborate. One example is for JSW licensed users to be able to add internal comments to JSM tickets as well as setting up guidelines for how to use the participant field when collaborating with the end users. We’ve seen dual licenses many times, and often it is not necessary.